Good Day Traders,
Thanks for all the great comments about the ATTS service and the “How to Make Money Trading Stocks” webinar that blast out every Friday at 10 a.m. Pacific. Please let others know about this great webinar! You can either join live or catch the replay on YouTube.
Here’s the link for next Friday’s Show: https://attendee.gotowebinar.com/register/6480205243828428802
No Wednesday Night Training this week. September has 5 Wednesday’s so this will be an off week. Next Training September 16, 2015
For Premium Members our Wednesday evening training is developing some fantastic traders!
Mid-Week Market Sanity Check Topic: Pinpoint Entries
_____________________________________________________
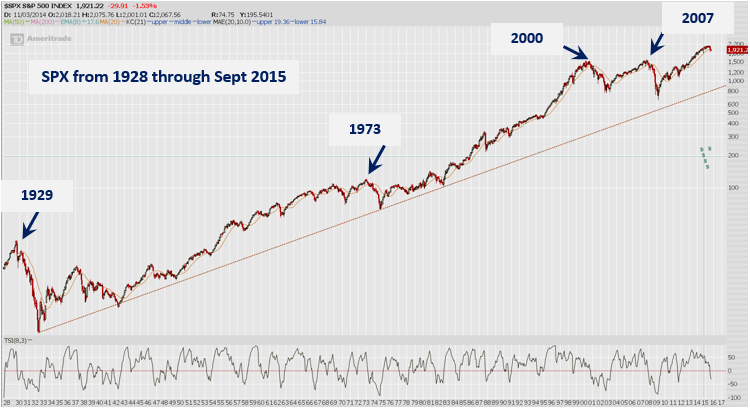
General Market Observation: Rather than provide a short term look at each of the tracking indexes and about what we can potentially expect this week, I want to provide a more macro and historical view. Coming into this weekend we’ve had a tough August where the markets have turned lower and are now on the cusp of a correction. The chart below is a monthly chart on the S&P going back to 1928 prior to the turndown that was named the Great Depression. A couple of things to note on this chart. First the long term uptrend that started in June of 1932 is still intact. Secondly there have been some very healthy downside moves or corrections during this long-term uptrend. The moving average on the chart is the 20 month moving average which until last month price action has respected for the past 4 years. Closing below this moving average is an event that needs to attract our attention. It is either a pause before erupting into a new continuation of the long-term uptrend or the first indication that the downtrend will worsen and lead a more significant correction (Bear Market).
If this is just a pause before continuing higher then we can expect a move back through the moving average and its role to switch from resistance to support again. However if this is really the first step before a deeper plunge there will be certain clues we can look for. I’ll highlight a few historic tops to see what they have in common. This will prepare us for the potential clues that may appear.
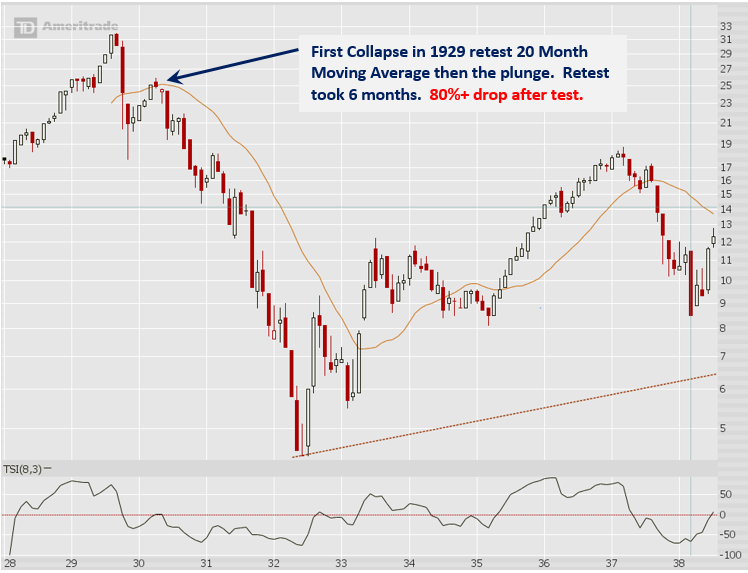
Chart 1929: The crash of 1929 provides the first example of what happens prior to the big acceleration downward. Note how it takes several months for price to retest the 20 month moving average as the internals of the market continue to weaken. Finally like a failed stress test price action gives way to a wild ride that in this case lasted almost 2 years.
Chart 1973: The drop of 1973 and 1974 is the years that my mom and dad decided to start investing in mutual funds—now that’s crumby timing! This also tainted their view of the stock market for the rest of their lives. While the chart is not exactly like the crash of 1929 note the similarities. A drop below the 20 month moving average, failure to get back above the resistance and then an acceleration to the downside. This negative move lasted for a bit over a year.
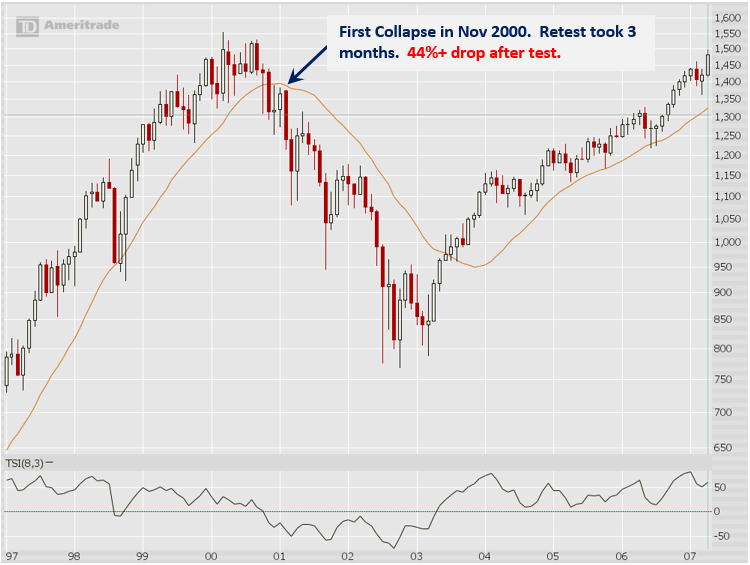
Chart 2000: The .Com Bubble didn’t look exactly like the previous major correction but it still had some of the same characteristics. Drop the 20 month moving average and weakly try to rebound and then drop. This downside lasted almost 2 years.
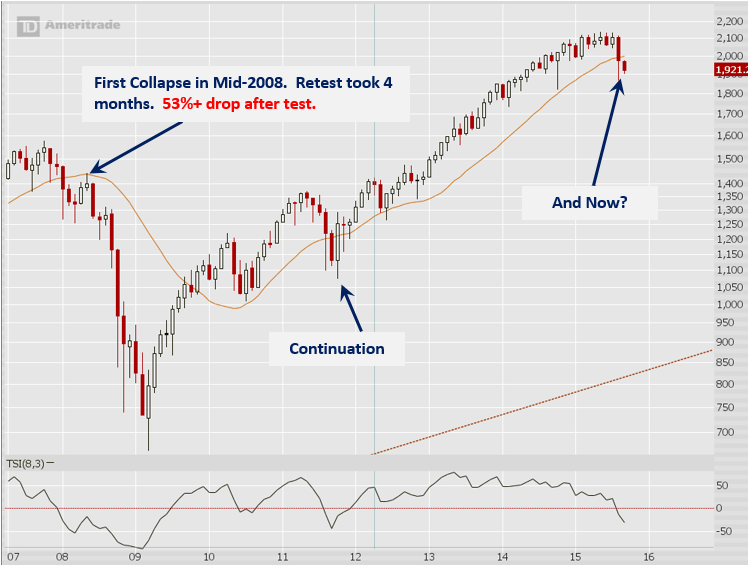
Chart 2007-2008 and Current: Again check out the similarities of the 2007-2008 and follow on correction with its predecessors. A well-defined flag up to the 20 month moving average over several months and then the plunge. Note that correction while steep lasted only about a year. Was short but deep correction because of smart government interference or just a more globalized market?
This last chart is very instructive because it provides both the market collapse of 2007-2008 and also the rebound continuation move from 2011 for comparison. The chart also shows current market conditions. How should we interpret what’s going on now? Is closing below the 20 month moving average the start of further collapse ala 1929, 1973, 2000 or 2008? Is it the start of a pullback like 2011? At this point we don’t know but we do have clues. The major clue is the 20 month moving average and the character it takes on. If resistance is the personality then the 2000 point level will be the zone where price action should hit and fallback. If broken to the upside and the 20 becomes support then its role will have been reversed. My opinion is that resistance will prevail due to the age of the current uptrend. But I’m not married to this opinion!
SPX: Preferred ETF’s: SPY and SPXL
NDX: Preferred ETF’s: QQQ and TQQQ
RUT: Preferred ETF’s: IWM and TNA
_____________________________________________
The Early Warning Alert Service has hit all three major market trading point this year. See this brief update video for more details: https://youtu.be/PRLmPQLHjiI
If simplifying your life by trading along with us using the index ETF is of interest you can get the full background video at: https://activetrendtrading.com/etf-early-warning-alerts-video/
The How to Make Money Trading Stock Show—Free Webinar every Friday at 10 a.m. PDT. This weekly live and recorded webinar helped traders find great stocks and ETF’s to trade with excellent timing and helped them stay out of the market during times of weakness.
The “How to Make Money Trading Stocks” Show is back this Friday, Sept 11th
Ensure you get a seat by registering now at:
https://attendee.gotowebinar.com/register/6480205243828428802
To get notifications of the newly recorded and posted How to Make Money Trading Stocks every week subscribe at the Market Tech Talk Channel: https://www.youtube.com/channel/UCLK-GdCSCGTo5IN2hvuDP0w
- The Active Trend Trader Referral Affiliate Program is ready. For more information or to become an Affiliate please register here: https://activetrendtrading.com/affiliates-sign-up-and-login/
_______________________________________________________________
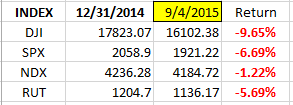
Index Returns YTD 2015
ATTS Returns for 2015 through Sept 4, 2015
10.0% Invested
Margin Account = +4.84% (Includes profit in open positions)
Early Warning Alerts = -0.78%
Active Trend Trading’s Yearly Objectives:
- Yearly Return of 40%
- 60% Winning Trades
For a complete view of specific trades closed visit the website at: https://activetrendtrading.com/current-positions/
Updated first full week of each month.
Managing Existing Trades: No Strategy 1 or 2 trades open.
Special Trades: Wealth & Income Generation Strategy 3 Trades: Closed out the IWM Sep1 117C last week for a profit of $408 for the week. Currently there are 5 short put and call contracts outstanding on the Call and Put legs of this strategy. 5 contracts of the Sep2 111.5P were sold on Friday for $1.01 per share and 5 contracts of Sep2 114.5C was sold at $1.44. An initial GTC order is in place to buy back the short options at a nickel. This may be adjusted midweek if prices or volatility provide an approximate $400 per side profit.
My objective is to collect $814 per week to achieve a 50% return on this trade by expiration of the long LEAPS in January 2016.
Several members have asked about this strategy and a more detailed explanation is available at: https://activetrendtrading.com/wealth-and-income-strategy/ .
I posted a video about how to choose the weekly options to short for this strategy. It can be viewed at: https://activetrendtrading.com/videos/
Additionally some of these trade may be selling weekly puts on up trending stocks. If you are interested in parallel trading this strategy register at this link: http://forms.aweber.com/form/99/1278533099.htm
Pre-Earnings Trade: No Pre-Earnings Trades
_________________________________________________
Potential Set Ups for this week: The market continues to correct and September tends to be a do nothing weak month. Additionally as covered in last Wednesday’s Training given the tough trading year it is time to focus on just a few stocks and Index ETFs that have been traded successfully in the past. There are only 16 trading weeks until the end of the year. While the market has been challenging thus far this year I will not increase my risk by being impulsive or swinging for the fences but will improve my focus and do more of what’s working. With current volatility short term trades are in order.
Upside: Looking for an entry on TSLA as a long-term position. This will be a combination of owning shares and a 2017 LEAPs option to sell weekly premium against. The expectation is that TSLA will start a steady climb towards a target of $465. Additionally, I will trade either the leveraged index ETFs or options on the non-leveraged Index ETF’s at support levels if all timeframe charts are in synch. Two other stocks that are holding above their 50 day moving averages that may provide a bounce with a positive market are AHS and SCMPS.
Downside: The non-leveraged Index ETF’s when price is at resistance. We will be covering how to pinpoint entries using the intraday chart (you don’t have to watch the chart all day) at our next training. Other candidates include NFLX on a flag up. GPRO on a pullback to at least 1/3 of last week’s candle. AMBA on a retracement back towards the 200 day moving average.
Toss Ups: CAVM is holding up well in a trading range. Watch for weakness at the top of the range and strength at the bottom. The current range between 61 and 74 is about 22%.
Leveraged Index ETFs: Waiting for set ups for the Early Warning Alerts.
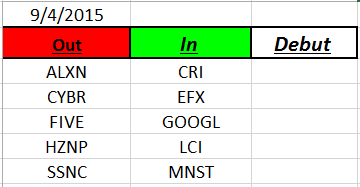
Outs & Ins: No new debuts to this week’s IBD 50 just a swap out of past members. If you are wondering why stocks move on and off the IBD 50 with such ease? The reason is that this is a computer generated list and sometimes there is only a fraction of a point difference in their strength scores. This is one of the reason discovering the importance of tracking the Running List. Occasionally a past leader would fall off the list and then start showing strength later in the year. By never losing sight of these stocks it provided clues of the comeback weeks and months before the stock climbed back on the IBD 50.
Currently there are only 16 of the IBD 50 above their 50 day moving average. If one is focusing towards long trades then focus on CMG, SIG, STZ, ALK, AHS, SCMP, SWHC, FL, CDW, CALM, ICLR, GPN, SSNC, PAYC or CDNS. Wait for proper set ups.
Comments and opinions written below this line of text may be provocative and only obliquely related to trading. Some may find these “Off the Wall” comments challenging to their outlook on life. I will not post any comments made on subject matter below this line, so if you disagree blast away.
OFF THE WALL
Off the Wall: When an athlete is learning a sport like baseball, basketball, football or golf they develop a favorite move, or pitch or shot. They practice and practice this special move until it becomes so second nature that when the pressure is on and they need their best they go to that move. In golf it may be a particular club they can count on hitting close to perfect every time. In baseball it maybe that perfect pitch that has been hit successfully in the past more often than not. In basketball it maybe a turnaround jump shot from a specific point on the court. This move may not work every time but the player knows that if they execute like they practice this move provides the greatest probability of success.
Learning to have a favorite move in trading is also important. This can be a specific stock that the trader knows intimately that has been traded successfully in the past. It can be a favorite set up that typically leads to a successful trade. Each trader needs to have one of these “go to” trades when they need to improve the probability of making a profit.
Can you imagine a basketball player who doesn’t have a “go to” move? In one game he may try a hook shot and then next he may throw the ball over his shoulder backwards not even looking at the basket. The probability of success with such an impulsive approach would be pretty low. Well traders the same goes for us. Not having a “go to” strategy or type of trade can lead to our being impulsive and trying to figure it out on the fly. While it may be exciting when successful the probabilities are against us! This will not be healthy for our accounts.
Share Your Success: Many of you have sent me notes regarding the success you are having with the Active Trend Trading System. Please send your stories to me at dww@activetrendtrading.com or leave a post on the website. Thanks.
