Good Day Traders,
Overview & Highlights: Is the Grim Reaper just around the corner regarding the stock market? Mike Trager’s article for this weekend takes up some of the ominous signs showing up. Or will it be different this time?
Here is a sample of the weekly stock update I’m working on which will list the stock or ETF along with detail about where to execute a trade. This sample is not a recommendation just a sample of the format I’ll use. My intention is to post a simple table like this providing the basics so members can be better prepared for the week. Member’s feedback would be appreciated.
Webinars: At Active Trend Trading we offer two webinars per week to provide training plus trade and market updates. See the schedule below for the next webinars.
How to Make Money Trading Stocks on Friday, May 27th
Register Here: https://attendee.gotowebinar.com/register/9167586490169816324
11:30 a.m. PDT
Next Training Webinar: May 25th
For Premium Members our Wednesday evening training is developing some fantastic traders!
Mid-Week Market Sanity Check Topic: Target Shooting Entries & Exits with ATTS
Managing Existing Trades: Positions open for 3 strategies.
Strategy I Portfolio Building: Long 100 shares of TZA
Bought 200 shares of TZA at 41.60
T1 = 5% -10% to close 100 Shares
T2 = Attempt to hold remaining shares up to earnings and then close
Stop Loss = Will hold and sell weekly covered calls on remaining position to reduce cost basis while waiting for the Market downturn. Will hold for 8-10 weeks
Hit T1 sold 100 shares at 43.79 for a gain of 5.26% or Profit of $219.00
Strategy II Income Generation:
Sold 1 contract weekly TZA 20 May 44C at 0.71, bought back at 0.08 for a profit of $63
Speculative Trade going on VXX
Opened speculative trade with the expectation that volatility will pick up between now and June. Bought 5 contracts of VXX Jun 19C at 1.42
Will let this trade play out over the next 4-5 weeks. I will close out 3 contracts at 2.84.
The timing on this VXX trade may have been a tad early so I’ll be looking for a potential trade in a month further in the future.
Strategy II stocks of interest for this week: TSLA, SPX & Index ETFs.
For members wanting to better understand this Strategy there is a very good training video at: https://activetrendtrading.com/basic-option-strategy/
Strategy III Wealth & Income Generation Trades: Two Foundational Positions are in place to sell weekly options against. The recalculated weekly revenue needed from these foundational positions was forward in an update report earning last week. My objective with this Strategy is to collect enough weekly premium during the life of the LEAPS Strangle on both SPY and TSLA to both pay for the capital invested and gain between 50% – 100%.
Tip for Experienced Option Traders: Occasionally after a weekly trade goes against me but the trend appears to be changing I will add one naked contract over and above my foundation position and close this out after it gains at least half of the premium I’ve collected. Doing naked options is not for everyone and I keep my risk small by only doing one contract above my covered limit. In other words, if I can sell 4 contract covered by my long leaps I’ll sell one additional. This helps hedge the losses a bit but it this tactic is not without risk and must maintain a tighter stop than I would normally use with the regular position.
Note: We do our best to get both text alerts and email alerts out in a timely manner, occasionally there will be trades that are missed because of delay in the Text or Email alert applications. Additionally, please double check with your broker to assure they allow spread trades like we do with Strategy III. Some do and some don’t.
Strategy III Weekly Results Week ending 5/20:
SPY: Profit + $456
TSLA: Profit + $310
Trade 1: Foundation Position is 4 contracts of SPY Jan17 205C and 4 contracts of SPY Jan17 200P Current Trade—Currently Up 15.89%; Premium Collected since opening trade on 1/4/16 = $4608.
Sold 4 contracts of SPY 27 May 206.5C at 1.07—Potential Profit $428
Trade 2: Long TSLA Jan17 250C & Long Jan17 220—Current Trade—Currently Up 58.12%; Premium Collected since opening trade on 9/28/15 = $11,131
Sold 1 contracts of TSLA 27 May 220C at 4.15—Potential Profit $415
Several members have asked about this strategy and a more detailed explanation is available at: https://activetrendtrading.com/wealth-and-income-strategy/
I posted a video about how to choose the weekly options to short for this strategy. It can be viewed at: https://activetrendtrading.com/videos/
Additionally some of these trade may be selling weekly puts on up trending stocks. If you are interested in parallel trading this strategy register at this link: http://forms.aweber.com/form/99/1278533099.htm
Pre-Earnings Trade: So far our pre-earnings trades have worked out well for both Strategies I and III. The following have promise for Pre-Earning trades: THO, AVGO & FIVE
Pre-earnings trades can be a great supplement to the portfolio building portion of Strategy I. Depending on the stock and technical analysis they tend to be predictable and repeatable. For busy traders focusing on pre-earning opportunities can free one up from the necessity of constantly chasing stocks during other periods of the year. The process repeats four times a year and capturing a 5%-15% return four times a year can compound very nicely!
Potential Set Ups for this week: Now that monthly expirations are done until June (which should be a triple witching expiration) the minute upward bias from this week due to this action should abate. The June Feb meeting is on the horizon so stocks may maintain a holding pattern waiting to see if the Fed raises rates. What kind of a catalyst might that be? One observation over the past few weeks is that many stocks are showing ‘V’ bottoms. This type of bottom tends to be weak and can provide some violent correction once the momentum starts running out. Because of this we need to adjust expectations for returns on individual trades to smaller profit targets and tight stops. 5% – 15% are great objectives for initial targets and if hit setting breakeven stop losses is prudent.
Upside: LGND, OLED, GIMO, SIX, TZA, SQQQ and SPXU.
Downside: If the Indexes pullback from current resistance zone look for weak stocks or go to the inverse Index ETFs. Some weak stocks include: TREX, VNTV, SONC, BIDU, AAPL and NFLX
On the Radar: Stocks & ETFs that could go either way include: UPRO, SPXU, TQQQ, SQQQ, TNA, TZA, TSLA (270 resistance/140 support), ALK (reversion to mean trade), PYPL, LNKD, BABA, OLLI, NOAH, CRM, AMZN, FB and AOS.
Stocks identified by ** that are close to a potential entry point.
Early Warning Alerts for Leveraged Index ETFs: Waiting for Second Chance Entry trigger and Alert reset.
A downside trade for TZA triggered on 5/17 and a courtesy alert was sent to all EWA members. I plan on holding this position for the next 8-10 week or until price hits $55. During this time rather than a stop loss I will sell weekly covered calls. A major reason of choosing TZA is that it has weekly options which provides the opportunity to collect premium while price oscillate. Going forward Mike will trigger the long EWA alerts and I will trigger the short side triggers as courtesy alerts to members.
The Early Warning Alert Service hit all eight major market trading points in 2015. See this brief update video for more details: Early Warning Alerts Update Video or at https://youtu.be/GJwXCL4Sjl4
If simplifying your life by trading along with us using the index ETF is of interest you can get the full background video at: https://activetrendtrading.com/etf-early-warning-alerts-video/
Mike’s Macro Market Musings: “D” Is for Demographics and Death Cross
Those of you who have been reading these columns for a while must know that, while I may be wrong, I’m a bit skeptical about longer term prospects for U.S. equity markets for a whole host of reasons related to current equity valuations, history, precedent, reversion of market valuations to statistical means, etc. Recent reading has led me to another potential rationale for my skepticism, one that I had previously only superficially considered, having to do with the outsize influence of the baby boomer generation over many aspects of our society, including but not limited to the financial markets.
Much of the following is copied and pasted from another source. While I find the logic compelling, the hypothesis presented does not originate with me. For those who would like to read the full article, here’s the link: http://jessefelder.tumblr.com/post/114539830195/how-the-baby-boomers-have-blown-up-the-stock
“I think there’s a very simple explanation for the high stock market valuations since 1990: demographics. From 1981-2000, the baby boom generation came into their peak earning and investing years. Is it just coincidence that during that very same time we witnessed the largest stock market valuation bubble in history? No. In fact, there is a statistically significant correlation between demographic shifts like this and stock market valuations.”
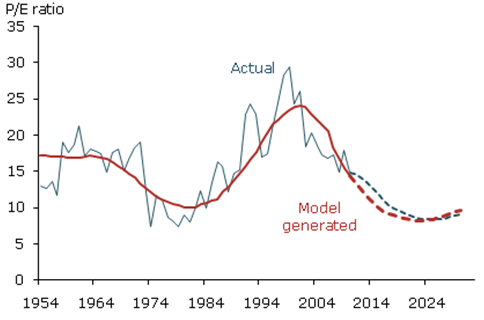
“A few years ago a pair of research advisors to the Federal Reserve Bank of San Francisco demonstrated this link. They found that demographics (specifically, the ratio between retirement age workers to peak earning and investing age ones) is responsible for 61% of the changes in the price-to-earnings ratio of the stock market over time.”
“All this means is that there is a very strong relationship between the size of the generation that is currently in its peak earnings and investing years and the valuation of the stock market. Over the past 25 years we have seen the single largest generation in our nation’s history, the baby boomers, push stock market valuations higher than they have ever been. It’s not magic; it’s simple supply and demand (mainly demand).
According to this theory, for valuations to remain elevated the stock market needs the generations that follow the baby boomers to maintain the same population growth that the baby boom represented. We already know that this just isn’t going to happen. The generation following the baby boomers, Generation X, represents a significant deceleration in population growth. For this reason, this model forecasts a contraction of the price-to-earnings ratio over the next decade, from about 18 last year to roughly 8 in 2025.”
(Note: Going back to 1954 on the above chart, I find the correlation between the p/e forecast by the research model and the actual realized p/e to be remarkable. If this correlation holds going forward as it has in the past, the projection is for overall U.S. equity index p/e ratios to approach 10 during the coming couple of years, a significant decline from p/e ratios currently approaching 23-24 for the S&P 500. And, of course, the p/e ratio can vary widely depending on what number is being used for the “e” (earnings), and forecasts for future earnings used for calculating forward p/e ratios have historically been notoriously inaccurate and overly optimistic) “Assuming an earnings growth rate of 3.8% over the coming decade, the historical average according to Robert Shiller, in forecasting 2025 earnings for the S&P 500 of 156.76. Apply an 8.23 p/e (forecast by the model) and you get a price level for the index of 1,290.”
“However, Cliff Asness has shown that earnings are very highly correlated with the level of inflation. With 10-year TIPS now implying inflation of less than 2% we can make new earnings forecast using that as our assumed level of earnings growth. In this case, we arrive at a 2025 earnings number of 131.75. Applying an 8.23 multiple we get a price level for the index of 1,084. This would represent a decline of about 50% over the coming decade, a truly horrific prospect.”
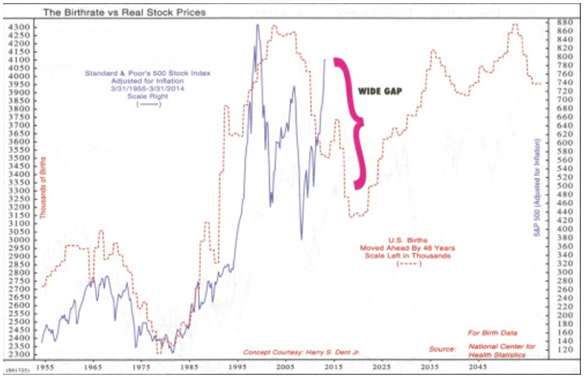
“Ned Davis Research has also studied this relationship and come to a similar conclusion. The chart below comes from Davis’ terrific book, “Being Right or Making Money.”
Of course, there are many factors that influence stock prices and valuations over time and demographics is just one of them. But it’s the only one I’ve found that convincingly explains the persistently high valuations we have seen since the 1990’s. And it doesn’t support the idea that high valuations are here to stay, as some may believe. In fact, it suggests just the opposite.” It remains to be seen if any of these projections will prove to be even remotely accurate. If so, my aforementioned skepticism will seem prescient. As the author states, many different factors can affect stock prices and valuations. However, I believe the influence of demographics should be acknowledged as at least one of them.
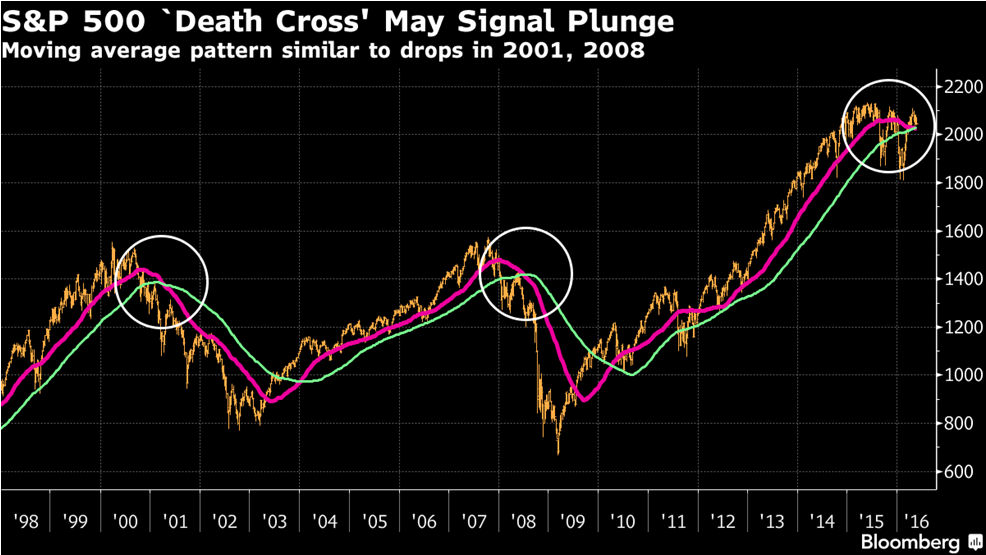
Of more immediate concern than the long term projected effects of demographics on financial markets may be the following. “Death cross” is the term given to the charting event of a significant downside crossover of two moving averages. Commonly, this term is applied to the downside crossover of the 50 day moving average below the 200 day moving average on the daily charts of the equity indexes, most notably the S&P 500. However, the term is also used to describe downside crossovers of significant moving averages in charts with other time frames. One of these is the relationship between the 50 and 100 period moving averages on the weekly SPX chart. The following chart shows that the 50-week ma is crossing below the 100-week ma in real time as of this past week (note that this is being written on May 19, 2016), a “death cross” in a different time frame:
Due to the long time frame involved and the length of the moving averages, this is a very lagging indicator that does not generate much whipsaw effect since it takes quite a long time for it to move and change and for crossovers to develop; they don’t come along very often. Over the past 20 years or so, this trend following crossover has generated 4 signals, 2 to the upside and 2 to the downside. All crossovers have been successful in predicting long term moves that have persisted for months and even years, moves that do not attempt to capture tops or bottoms but, if/when acted upon, have provided very profitable entries and exits into and from some big longer term trends. Note that this “statistically significant” death cross has only happened twice is the past two decades. The first took place in 2001 and was followed by a 37 percent decline in the index, while the second pattern occurred in 2008 and preceded a 48 percent drop. Is it different this time? Maybe. No signal or indicator is 100% predictive. Is being “different this time” a bet you should be willing to make? Maybe not.
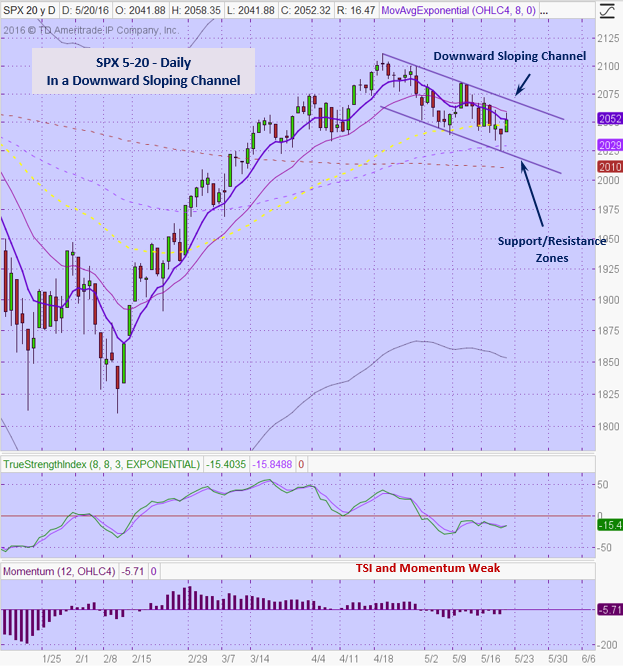
General Market Observation: Thus far the newly started downtrend on the Tracking Indexes appears to be a casual pullback and not panicked dive. Each Index is bouncing between downward sloping support and resistance. One of the major premises of trend analysis is that price action will continue doing what it is doing until it doesn’t. This includes symmetry of price action and repeatability of price action. The rule of the trend is a lot like Newton’s Laws of motion. Our job as Technical Analyst is to wait patiently for price action to provide proper entry points at definable levels of support and resistance to trade. Additionally, to trade mostly in the direction of the prevailing trend.
The SPX provides a great picture of what’s going on in the chart below. Price action for the past 5 weeks has been oscillating within the downward sloping channel. So at least short term trades to the downside at definable and defendable levels of resistance provide the highest probability of success until the trend changes. This trend channel is about 2.5% wide so waiting for appropriate entry points can yield good returns if trading either options on the SPY or the leveraged inverse ETF’s. If we wait for the appropriate entries, we may be invested if a more significant downward move takes place. There are two different levels of resistance to watch for this week, first is the 8/20 day moving average combo. The second is the top of the trend channel. These would be appropriate places with the current short term trend in place to take action. For this week I’m watching a resistance zone between 2058 and 2070. If the 2070 level is breached to the upside, then the next levels of resistance will come into play. I’ll also watch support at the bottom of the channel or the 100 day moving average.
After falling faster than the SPX, the Nasdaq 100 is stuck in a sideways channel. A similar analysis provides strong support 4284 and resistance at the 4400 level. Wait for trades until price is at either of these extremes.
The Russell is providing a downward sloping trend channel which can be treated like the SPX. The RUT still has a downward sloping 200 day moving averages which may provide resistance at about 1116. Often the RUT will lead the other indexes with direction and reaction. If rumors that the Fed will raise rates in June continue to grow price action may gain downside momentum. We are position for this potential currently by owning shares of TZA the inverse index ETF for the Russell. While waiting I will offset the cost of this position by selling weekly calls at the appropriate points.
SPX: Downside Market Short the SPY, SPY Puts or SPXU.
Preferred Long ETF’s: SPY, UPRO and SPXL
NDX: Downside Market Short the QQQ, QQQ Puts or SQQQ.
Preferred Long ETF’s: QQQ and TQQQ
RUT: Downside Market Short the IWM, IWM Puts or TZA.
Preferred Long ETF’s: IWM and TNA
The How to Make Money Trading Stock Show—Free Webinar every Friday at 11:30 a.m. PDT. I’m looking for the best time to offer this webinar. I want to try closer to the close on Friday to see how that works out for potential trades going into the close. This weekly live and recorded webinar helped traders find great stocks and ETF’s to trade with excellent timing and helped them stay out of the market during times of weakness.
How to Make Money Trading Stocks on Friday, May 27th
Register Here: https://attendee.gotowebinar.com/register/9167586490169816324
11:30 a.m. PDT
To get notifications of the newly recorded and posted How to Make Money Trading Stocks every week subscribe at the Market Tech Talk Channel: https://www.youtube.com/channel/UCLK-GdCSCGTo5IN2hvuDP0w
– The Active Trend Trader Referral Affiliate Program is ready. For more information or to become an Affiliate please register here: https://activetrendtrading.com/affiliates-sign-up-and-login/
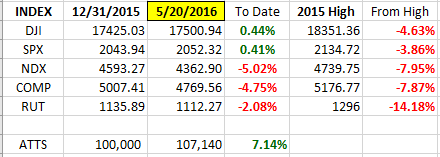
Index Returns YTD 2016
If the Indexes are slipping off the ledge we could see a retracement to yearly lows in the short term of a few weeks. Note both DJI & SPX are barely in positive territory for 2016, but NDX and COMP are looking weak!
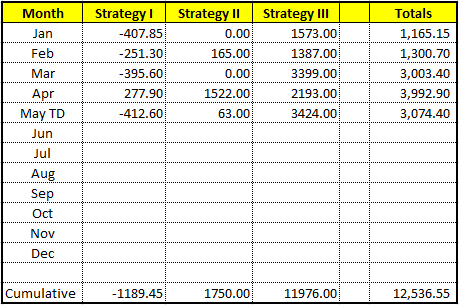
ATTS Returns for 2016 through May 6, 2016
I’m pleased how the ATTS system has shown growth every month of the year thus far. We are managing Strategy I which encompasses portfolio building well because thus far this year it has not been a great portfolio building year. The quick hitting option trades of Strategy II are working along with the steady Income & Wealth objective of Strategy III.
Percent invested $100K account: Strategies I & II invested at 3%; Strategy III invested at 20%.
Current Strategy Performance YTD (Closed Trades)
Strategy I: Down -1189.45 or -1.19%
Strategy II: Up $1750 or 17.5%
Strategy III: Up $11976 or +59.8%
Cumulative YTD: 12.5%
Active Trend Trading’s Yearly Objectives:
– Yearly Return of 40%
– 60% Winning Trades
– Early Warning Alert Target Yearly Return = 15% or better
For a complete view of specific trades closed visit the website at: https://activetrendtrading.com/current-positions/
Updated first full week of each month.
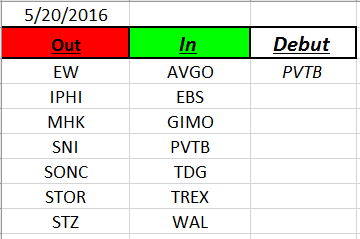
Outs & Ins: PVTB was added to the IBD 50 this weekend. Currently this stock is consolidating between 32 and 46. Might be a potential candidate on pullbacks to the 8 or 20 day EMA’s. Some believe bankers will catch a bid if the Fed does raise rates on June 15th. As expected many of the stocks on the IBD 50 are showing similar patterns to the Indexes. The show very sharp raises since mid-February and now signs of consolidating or resting while the next move is decided. While steep, quick rises usually do not end well, if prices can consolidate and hold at one of the primary Fib Retracement levels the stock may bounce back up to resistance along with the Indexes.
Potential candidates this week. Downside: TREX & VNTV. Upside: LGND, OLED & GIMO. Pre-Earnings: AVGO, THO & FIVE.
Share Your Success: Many of you have sent me notes regarding the success you are having with the Active Trend Trading System. Please send your stories to me at dww@activetrendtrading.com or leave a post on the website. Thanks.


