Good Day Traders,
Thanks for all the great comments about the ATTS service and the “How to Make Money Trading Stocks” webinar that blast out every Friday at 10 a.m. Pacific. Please let others know about this great webinar! You can either join live or catch the replay on YouTube.
Here’s the link for next Friday’s Show: https://attendee.gotowebinar.com/register/2520878164445506306
For Premium Members our Wednesday evening training is developing some fantastic traders! Mid-Week Market Sanity Check Topic: Mid-Year Review & Candlesticks 1
_____________________________________________________
General Market Observation: I’ve got good news and bad news for this weekend’s Trader’s Report. The good news, the USA Women’s soccer team won the World Cup! I saw the awards ceremony which was just the right amount of exposure I needed. Not a big soccer fan, it’s a generational thing! But love what the ladies did in this tournament! Go USA!
Now the bad news. Greece voters said NO! Currently futures are down about 200 points on the DOW. So as we set up for next week it is a good thing to be invested at such a light level! There is probably a lot the US could learn from what’s going on in Greece regarding what happens when a large portion of the population eats from the government trough on borrowed money. I think there are some more important dots to start connecting that could affect our markets due to the Greek default. If prices open at the levels of the current futures then I this week may be another very volatile week. Connect the projected market downside to the level of Margin Debt currently being carried in the US. Connect that Greek default leads to major selloff and major selloff could lead to margin calls, which could lead to more selling which could lead to more margin calls which could lead to…. Get the idea? While this sounds kind of simplistic just remember that selling can reach a tipping point where selling begets more selling which begets panic! What’s the Fed going to do if things start to unravel? Their silver bullets have been spend and delaying interest rate hikes simply delays the event.
Check the charts from back in 2000 and 2007, if history repeats or put another way if human nature repeats there will likely be a first significant move down and then a healthy rebound that fails to reach past highs and then the topping process continues to unravel the market until the major fall. The major fall can be weeks and months after the fatal blow was struck! Could Greece and the reaction to it be the fatal blow? We shall see. As we’ve seen over the past few months shorter term frame moving averages have become less reliable for support and resistance benchmarks. Waiting for proven levels of horizontal support and resistance provides more reliable clue. Waiting is key! Monday’s action may drop to a solid level of support, but will it lead to a one day reversal? TBD!
__________________________________________________
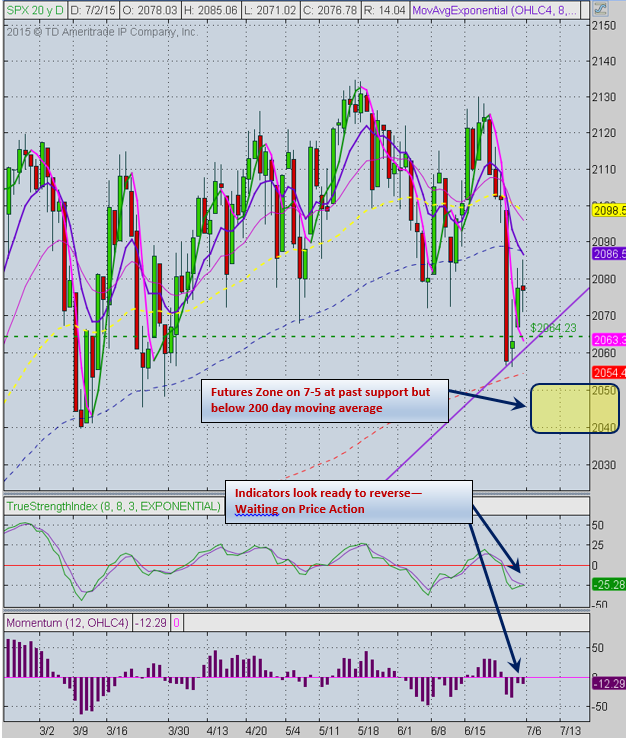
SPX: Based on this evening’s futures prices on the S&P may open tomorrow around the 2045 swing low level from March 26th. This level is below the 200 day moving average. This will be the third time in the past year that price action has visited this level. Often this characteristic is classic when it comes assessing the early stages of a topping pattern. This does not mean that there will be no viable short term bullish trades but they may be short lived. Depending on how things work out in the European market tomorrow morning if prices remain at current levels this will be the first break of the uptrend channel since October 2011 depending on how one draws the channel. Regardless the S&P and other tracking indexes are at a critical juncture.
On the bright side daily indicators are showing some positive divergence and weekly indicators are looking primed for a reversal even if it is short lived. We want to see how the Index reacts to a major sell off!
Preferred ETF’s: SPY and SPXL
 NDX: Futures are dropping to past support that equates to 4350. Will this drop hold overnight? We shall see. A positive from the initial reaction playing out afterhours is that often by the time the market opens the index is primed for a rebound immediately at the open. There is support at the 4350 level and strong support at the 4290 level. If the markets bounce there I be looking for clues regarding the strength of a bounce. If a bounce is anemic then then the 100 day & 50 day EMA’s may be upside targets for bearish flag rebounds. Within the topping process there will be several tradable opportunities for the patient. With that said this can also be a phase in the price action that is prone to whipsaw. Position sizes on the index ETFs and stocks should be kept small until a well-defined new trend is established.
Preferred ETF’s: QQQ and TQQQ
RUT: If the Russell drops and closes below the 100 day EMA this could be a clue that the strength from the index that had led it up is not depleted and it will continue to accelerate to the downside. This index tends to move more quickly than the other indexes in both directions. It also has a habit of leading in the new market direction. Support is present between 1210 and 1220. These are the levels to look for rebounds.
Preferred ETF’s: IWM and TNA
_____________________________________________
The Early Warning Alert Service has hit all three major market trading point this year. See this brief update video for more details: https://youtu.be/PRLmPQLHjiI
If simplifying your life by trading along with us using the index ETF is of interest you can get the full background video at: https://activetrendtrading.com/etf-early-warning-alerts-video/
The How to Make Money Trading Stock Show—Free Webinar every Friday at 10 a.m. PDT. This weekly live and recorded webinar helped traders find great stocks and ETF’s to trade with excellent timing and helped them stay out of the market during times of weakness.
The “How to Make Money Trading Stocks” Show is back this Friday, July 10th Ensure you get a seat by registering now at: https://attendee.gotowebinar.com/register/2520878164445506306
To get notifications of the newly recorded and posted How to Make Money Trading Stocks every week subscribe at the Market Tech Talk Channel: https://www.youtube.com/channel/UCLK-GdCSCGTo5IN2hvuDP0w
- The Active Trend Trader Referral Affiliate Program is ready. For more information or to become an Affiliate please register here: https://activetrendtrading.com/affiliates-sign-up-and-login/
_________________________
ATTS Returns for 2015 through July 5, 2015
Less than 1.1 % Invested
Margin Account = +2.02 % (Includes profit in open positions)
Early Warning Alerts = +5.32%
Active Trend Trading’s Yearly Objectives:
- Yearly Return of 40%
- 60% Winning Trades
For a complete view of specific trades closed visit the website at: https://activetrendtrading.com/current-positions/
Updated on July 6th
Managing Existing Trades: No Open Strategy 1 Trades.
Special Trades: No Open Strategy 2 Trades.
Strategy 3 Trades, waiting for weekly set ups. I held off on opening new short legs to the put and call Leap knowing the uncertainty of the Greek referendum. I’ll let the index settle a bit and place orders at appropriate levels of support and resistance as they are tested.
Additionally some of these trade may be selling weekly puts on up trending stocks. If you are interested in parallel trading this strategy register at this link: http://forms.aweber.com/form/99/1278533099.htm
Pre-Earnings Trade: Earnings begin later in July.
Potential Set Ups for this week: The major objective for tomorrow’s market is to assess which stocks hold up best if the market continues to sell off. Stocks that are at the 50 day EMA and showing weak candles may continue to fall. Stocks that are already below the 50 may accelerate their fall. Watch which stocks hold uptrend or simply look to be pulling back these may be the first to bounce with any Index rebound.
Upside: GTN look promising as long as the lower level of its current consolidation holds.
Downside: Downside candidates include: AMBA, XRS and GPRO.
Toss Ups: I’m categorizing several stocks as toss ups that could go either way. These include: YY, SWKS, BIDU, AFSI, FEYE, DATA, BITA, QIHU, VDSI, CYBR and CUDA.
Leveraged Index ETFs: Long TQQQ with a target of 110.50 and a Stop Loss of 104.40. We discussed that triggers for the Early Warning Alerts and said that this current signal could be a fake out like we saw last October. From the first fake out last October a second signal resulted about 10 days later which led to a significant gain.
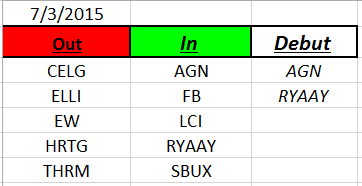
Outs & Ins: AGN and RYAAY make their debut on the IBD 50 this weekend. AGN tested the 50 day EMA last week and has provided a weak rebound up to past resistance. No trade here. Not much to get excited about with RYAAY either. Price action is in a slow moving uptrend with resistance at 74.
Several of the top 10 stocks on this weekend’s list look very weak. If market weakness increases look for a reshuffle in the list by mid-week. Stock like AMBA look ready to fall. Since GPRO is a related stock that has proven to be weaker than AMBA a bigger drop may happen with GPRO.
Comments and opinions written below this line of text may be provocative and only obliquely related to trading. Some may find these “Off the Wall” comments challenging to their outlook on life. I will not post any comments made on subject matter below this line, so if you disagree blast away.
OFF THE WALL
Off the Wall: I hope all had a great July 4th. Regardless of its flaws and missteps the noble experiment that is the United States remains a beacon of liberty and freedom. Always remember to assess whatever the politicians or government says by considering will what they want enhance our liberty and freedom or take away from it. This great country was established to be by and for the people…all people.
Share Your Success: Many of you have sent me notes regarding the success you are having with the Active Trend Trading System. Please send your stories to me at dww@activetrendtrading.com or leave a post on the website. Thanks.


