Good Day Traders,
Thanks for all the great comments about the ATTS service and the “How to Make Money Trading Stocks” webinar that blast out every Friday at 10 a.m. Pacific. Please let others know about this great webinar! You can either join live or catch the replay on YouTube.
Here’s the link for next Friday’s Show:
https://attendee.gotowebinar.com/register/1419510562872626433
Next Training September 30, 2015
For Premium Members our Wednesday evening training is developing some fantastic traders!
Mid-Week Market Sanity Check Topic: 4th Quarter 2015—Back to the “8”
_____________________________________________________
General Market Observation and Highlights from this Edition: I’ll start off with the highlights from this edition then jump to the market observation. Over the past week Mike and I discussed some of the challenges the market has presented this year. This discussion led to looking at some short-term and long-term charts. What we discovered was that some unnecessary filters were interfering with the simplicity the Active Trend Trading System was designed on. During back testing and forward testing on the ATTS the most reliable confirmation an entry triggers was utilizing the 8 eight period EMA. Mike’s article this weekend highlights the simple power of using a 10 month moving average to take advantage of major market swings. What Mike covers in the article is also applicable when replacing the 10 month moving average with the 8 month moving average. One thing we learned is that when prices are below the 8 period EMA on a weekly or monthly chart a trader’s market posture should be to the downside. Mike’s article is very timely and ties in nicely to our training this Wednesday night. We investigate how getting back to the “8” on all timeframes will provided more consistent performance.
Be aware that Think or Swim upgraded their trading platform this weekend. If TOS is your trading platform take some time this weekend to familiarize yourself with the improvements.
The major observation for the market this week is that the NASDAQ 100 has accelerated to the downside. This week the indexes swing lows from August 24th may be tested. If we use the 8 week EMA as a benchmark our focus should be on downside trades primarily.
__________________________________________________________________
Mike’s Macro Market Musings: Trend Following and A Simple Strategy
Trend following strategies and methodologies have been employed by any number of investors and traders over a number of decades to create true wealth from the financial markets. They are as numerous and varied as are the participants in the financial markets and provide the core methodologies for many quantitative hedge fund strategies. They are designed not so much to try to capture market tops and bottoms, but more so to take advantage of a new trend once there is evidence that it is in place – hopping on the train once it has left the station, so to speak – and to stay with that trend until there is evidence that it has ended, or getting off the train only after it has stopped and turned around. For those who read and subscribe to IBD, the core IBD methodology is essentially an intermediate term trend following strategy based on resistance breakouts.
Many trend following strategies employ the relationship of price to moving averages or the relationship of moving averages to each other. One example is simply a moving average crossover technique, and a popular example of this is the crossover of the 50 day simple moving average and the 200 day simple moving average, often referred to as the “golden cross”. These types of systems are simple in their construction and fairly easy to back test. The downside to these, and the reason they are not more commonly utilized especially among the retail trading and investing public, is that they are prone to whipsaw losses and win-loss ratios are often below 50% or even 40% – it is extraordinarily difficult for most people to stick with a strategy that produces losses 50-60% of the time even when it is a long term effective system, especially during losing streaks. And this can, and does, happen. The core effectiveness of most trend following systems is dependent on the occasional big winning position that recoups and far surpasses the losses that previously accumulated – over time, there will be many small winning or losing trades that are more than made up for by the occasional breakout trade where a long term trend is captured and produces an outsized profit.
All of that being said, allow me to illustrate a sample of an effective strategy for the U.S. equity markets, especially potentially useful for those interested in longer term investing and/or utilizing retirement accounts with limits on trading activity. Note the specificity – this is only being applied to an index of the U.S. stock markets. Application to individual stocks, commodities, currencies, bonds, etc. is neither implied nor recommended without at least back testing over a substantial time period. It is a simple strategy utilizing the relationship of price to a moving average. In trading and investing, as with many things in life, simpler is usually better.
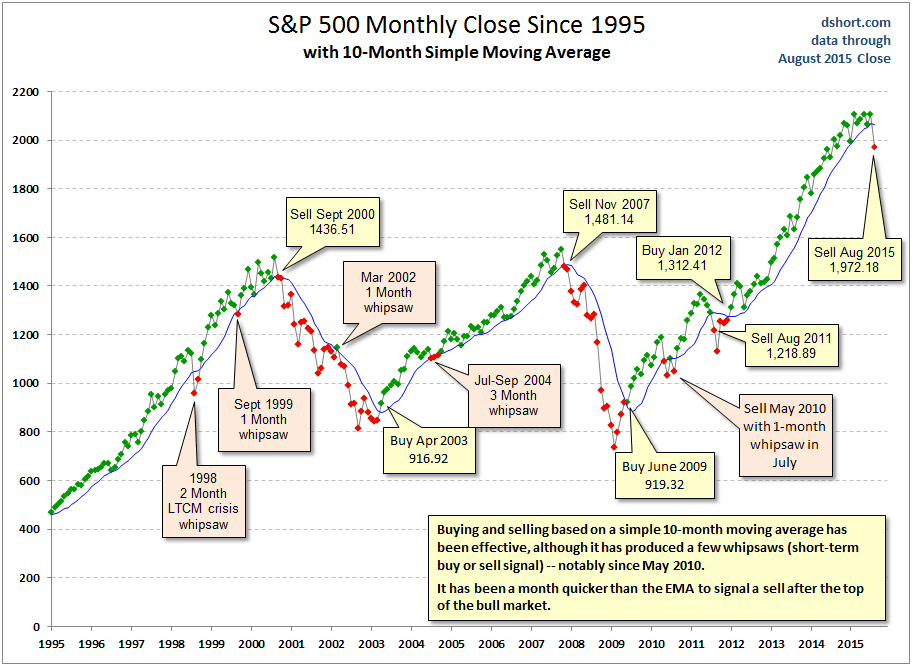
A long only strategy, this involves the price level of the S&P 500 index as it relates to the 10 month simple moving average (sma). On a monthly chart of the S&P 500, this is plotted simply by a ten period sma. No other indicators are necessary. The strategy is simply to go long (buy) the index when price closes above the 10 month sma and stay with the position for as long as price remains above the 10 month sma. This only needs to be checked once a month after the last trading day of the month. Exit the position when price closes below the 10 month sma and stay in cash until price once again closes above the 10 month sma. The vehicles to be used can be any of the mutual funds or ETF’s that replicate the index (SPY, for example) or the leveraged S&P index ETF’s.
Using the monthly chart and moving average eliminates the noise and volatility of the daily charts. The 10 month sma approximates the 200 day sma, a popular indicator for the large institutions, but eliminates the potential for excessive whipsawing around the 200 day sma on a daily chart. The following chart will illustrate the effectiveness of this strategy over the past 20 years and is current through the end of July, 2015:
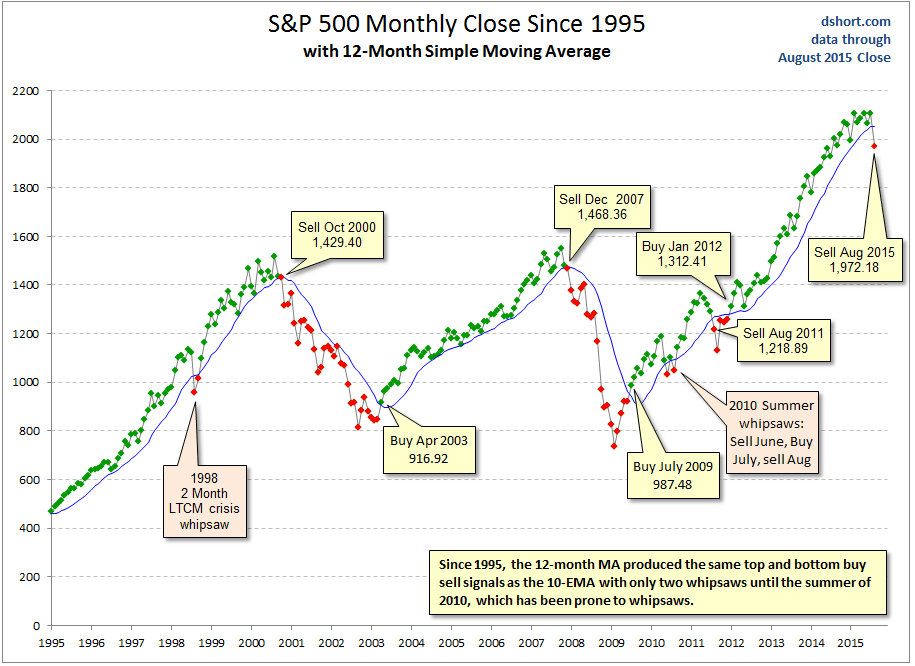
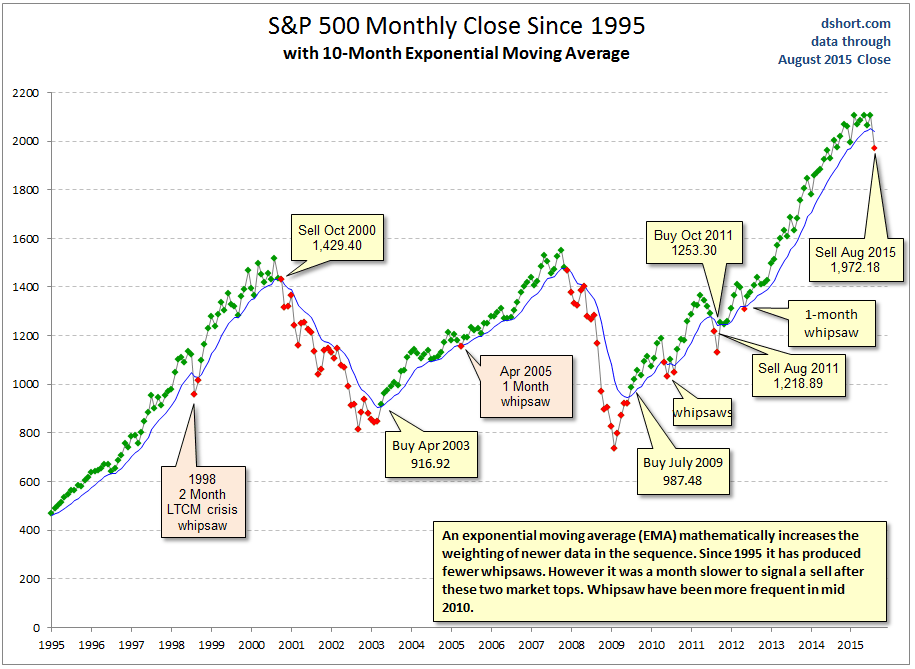
The blue line on the chart is the 10 months sma. The green dots indicate entries when the position is “on” and the red dots indicate exits when the position is “off” and one should be in cash. Going back to 1995, note how this strategy would allow one to capture and ride the three major uptrends in the U.S. equity markets while keeping one mostly unexposed to the losses that would have been experienced during the two major downtrends resulting from the dot.com bust and the 2008-2009 financial crisis. Note also that there are only two losing trades here in this 20 year span and a couple of trades that would result in very small gains. Similar results can be depicted if one were to look at a similar chart going back to the 1950’s. Also, similar results can be shown when utilizing this strategy with either a 12 months sma or a 10 month exponential moving average (ema), as follows:
The beauty of this strategy is its’ simplicity and the patience and discipline it forces on the investor in terms of entries, exits, and staying with the position if one strictly adheres to the minimal and simplistic rules. Some of these trends have lasted for years and yielded truly impressive results and since knowing when to exit is often the most difficult thing to do for many investors, this makes it easy. And, it keeps one on the right side of the long term uptrend of the U.S. equity markets over a period of more than 100 years while remaining minimally exposed to the occasional downturns that have, and will, come along; sooner or later, that long term uptrend is rejoined and presents a signal or trigger to participate. Not to mention that it requires minimal attention, effort, and activity. It can produce truly impressive results while making no attempt to time market tops and bottoms and capturing the bulk of the gains offered by our equity markets over long periods of time.
Will this strategy continue to perform as effectively going forward as it has in the past? While there is no reason to think it won’t, past performance is no guarantee of future results (where have we seen that statement before?). More thorough and rigorous quantitative back testing going back more than 20 years is highly recommended. If anyone cares to do this and present the results, I would be quite interested in seeing them. To be honest, I have not yet done so myself. I can be reached at mtrager@earthlink.net.
In this Wednesday’s Training we will cover how to take advantage these trend and what to do if you miss the first move.
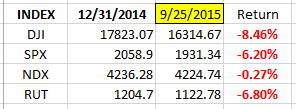
SPX: One of the scenarios that may work out over the next several days is for each of the Tracking Indexes to test near their swing lows from August 24th. For the S&P this would be a drop of almost 3 ½%. Year to date the SPX is down 6.8% and almost 10% from the year’s high. At this point either the 8 day EMA or 8 week EMA is acting as resistance and providing an excellent trade trigger for trades to the downside. As long as the 8 day or weekly EMA functions as a line of resistance traders can continue using this trigger. The tone of the S&P would potentially start to change with a close above the 8 day EMA. If support at 1911 fails the probability of reaching the swing low at 1866 significantly increases.
Preferred: SPY, UPRO and SPXL
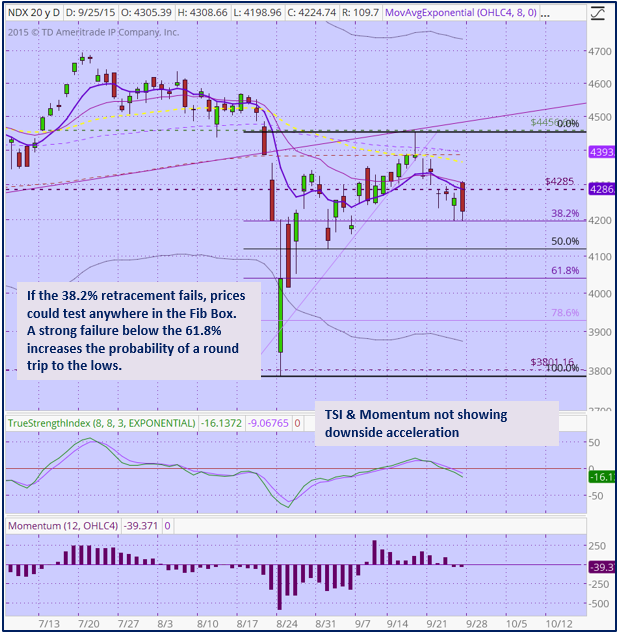
NDX: The NASDAQ 100 reversed downward off the 20 and 8 day moving averages on Friday and tested the 38.2% retracement at approximately 4200. Of the three Tracking Indexes on Friday the NDX was the weakest. The chart below shows how the 8 and 20 EMA’s are acting as resistance. If market weakness grows the NDX may plunge faster than the other two indexes. I’ll be watching the Fibonacci levels as NASDAQ continues to fall. As the chart reveals there is support at both the 50% and 61.8% retracement’s.
Preferred ETF’s: QQQ and TQQQ
RUT: The Russell was the weakest of the indexes on Friday. All the moving averages on a daily and weekly chart are in line for more downside. It appears as if the RUT has the potential for breaking through 1107 and revisiting the lows of October 2014. Friday’s close left the RUT down over 13% from the yearly high.
Each of the Tracking Indexes continue to operate in a down trend that appears to be more than just a short and shallow pullback. With last week’s mixed action the market is taking on more of a negative tone.
Preferred ETF’s: IWM and TNA
_____________________________________________
The Early Warning Alert Service has hit all three major market trading point this year. See this brief update video for more details: https://youtu.be/PRLmPQLHjiI
If simplifying your life by trading along with us using the index ETF is of interest you can get the full background video at: https://activetrendtrading.com/etf-early-warning-alerts-video/
The How to Make Money Trading Stock Show—Free Webinar every Friday at 10 a.m. PDT. This weekly live and recorded webinar helped traders find great stocks and ETF’s to trade with excellent timing and helped them stay out of the market during times of weakness.
The “How to Make Money Trading Stocks” Show is back this Friday, Oct 2nd
Ensure you get a seat by registering now at:
https://attendee.gotowebinar.com/register/1419510562872626433
To get notifications of the newly recorded and posted How to Make Money Trading Stocks every week subscribe at the Market Tech Talk Channel: https://www.youtube.com/channel/UCLK-GdCSCGTo5IN2hvuDP0w
- The Active Trend Trader Referral Affiliate Program is ready. For more information or to become an Affiliate please register here: https://activetrendtrading.com/affiliates-sign-up-and-login/
Index Returns YTD 2015
ATTS Returns for 2015 through Sept 25, 2015
10.0% Invested
Margin Account = +6.7% (Includes profit in open positions)
Early Warning Alerts = -0.78%
Active Trend Trading’s Yearly Objectives:
- Yearly Return of 40%
- 60% Winning Trades
For a complete view of specific trades closed visit the website at: https://activetrendtrading.com/current-positions/
Updated first full week of each month.
Managing Existing Trades: No Strategy 1. Good profit in a Strategy 2 trade on AMBA this week. Exited a long AMBA Oct 70P position for a profit of $560.
Special Trades: Wealth & Income Generation Strategy 3 Trades: Waiting for a new set up for Strategy 3. Pulled in over $509 in premium profit on the call leg of the trade.
I have also been running a test run of Strategy 3 with TSLA. Great results so far so I will buy a Jan 2017 Call LEAPs and then sell weekly premium. I will send out an alert on both buying and selling the TSLA position.
Several members have asked about this strategy and a more detailed explanation is available at: https://activetrendtrading.com/wealth-and-income-strategy/ .
I posted a video about how to choose the weekly options to short for this strategy. can be viewed at: https://activetrendtrading.com/videos/
Additionally some of these trade may be selling weekly puts on up trending stocks. If you are interested in parallel trading this strategy register at this link: http://forms.aweber.com/form/99/1278533099.htm
Pre-Earnings Trade: Earnings approaching.
_________________________________________________
Potential Set Ups for this week: This week there is a smattering of potential set ups in both directions. Applying the simplicity of Mike’s article using the 8 period EMA we can determine the direction of a stocks potential move. If the stocks on your watch list are currently below the 8 period EMA on either a daily or weekly chart look to trade these stocks to the downside. The opposite is true for the stocks and ETF’s that are currently hanging out above the 8 period EMA. Regardless the direction, staying true to this one rule will increase the probability of being on the right side of the trend.
Upside: The potential upside candidates are restricted to TSLA, PANW, Hawk, CRUS, TSO, and NKE. TSLA may be in the process of a healthy pullback in the short term. This could set up a trade for all 3 Strategies. A stock like Tesla can provide excellent trade opportunities as the market machinates about due its daily and weekly price range.
Downside: Candidates to the downside include GPRO, YY, FLT, INCY, CELG and LNKD. LinkedIn along with the index ETF’s may be the best downside candidates next week.
Toss Ups: Several stocks look like to go either way these include NFLX, CAVM, SWKS, AAPL, CYBR, and NOAH. Remember Cyber and Netflix both tried to break to the upside and failed to get above their 8 week EMA.
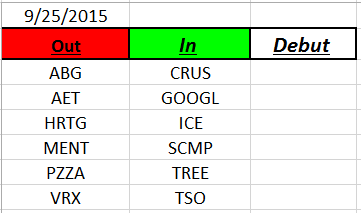
Outs & Ins: There was no new stocks added to the IBD 50 this week. If we apply the lesson of Mike’s article using the 8 week moving average there are currently 19 stocks on the IBD 50 that are below their 8 week moving average. If the markets continue to sell off some good downside candidates could emerge from these 19 stocks.
Some of the downside candidates that caught my eye are AVGO, UHS, and EW. The stock appears to be a tossup is SIG. Upside candidates include HAWK, CRUS, TSO, and NKE. Nike had a strong breakout last week on heavy volume so waiting for a pullback to retest around the breakout is advisable.
Comments and opinions written below this line of text may be provocative and only obliquely related to trading. Some may find these “Off the Wall” comments challenging to their outlook on life. I will not post any comments made on subject matter below this line, so if you disagree blast away.
OFF THE WALL
Off the Wall: A couple of weeks ago at church our pastor showed us a short video of two groups of people tossing basketballs back and forth. There were 5 players on both sides. Instructions were given prior to watching the video to count the number of times the group with the white ball successfully passed the white ball. So the congregation took on the challenge of focusing and counting every time the white ball changed hands. The players on both teams did their best Harlem Globetrotter’s impersonation moving and passing the balls behind their backs through their legs. It took a lot of concentrated focus to keep up. At the end of the two minute video we were asked how many times the ball was passed. The correct number was 12. Feeling good about how well I had focused and counted the correct number of passes I wasn’t prepared for the next question. The next question was how many saw the dancing black bear who moonwalk across the video? My wife raise her hand and I looked at her going what black bear?
The sound guys replayed the video only this time we were instructed not to count the balls but just watch the video. Sure enough right in the middle of all the commotion of two teams passing their white and black balls a dude in a black bear suit moon walked right between the two teams. The intended lesson was that sometimes we can focus so hard on being right or accomplishing a task that we might miss some very important details. In my mind I thought about traders and how we focus so hard on seeing what we think we want to see that we miss seeing what the charts really tell us. Of course there can be various reasons why we may misinterpret a chart that lead to placing questionable trades. This is one of the major reasons why we should always analyze charts on different time scales. By observing price action across several time frames it improves the probability of seeing that dancing bear and making better trades.
Share Your Success: Many of you have sent me notes regarding the success you are having with the Active Trend Trading System. Please send your stories to me at dww@activetrendtrading.com or leave a post on the website. Thanks.
