The Structure of the Trader’s Report is under revision. The new format will be launched in mid-August 2017.
Good Day Traders,
Overview & Highlights: It’s going to the be busy, short week for the last of May and first of June trading. I’ll be travelling to the Bay Area on Thursday to take care of the grandchildren for a week. I will also do a BAMM Meeting on June 3rd at the Masonic in San Jose. There will be no webinars on Friday due to previous engagements. If you happen to be in the Bay Area, come on down to San Jose on Saturday! The topic will be amazing an timed for making trading adjustments for the rest of the year!
Great article for Mike’s Macro Market Musing today. Mike provides additional food for thought regarding when Bullish Candlesticks are actually Bearish and vice versa. Mike also provides a bonus overview of a new Valuation Tool that could be excellent for timing!
Our seven focus ETFs continue to perform well this year. We know each of these leveraged ETFs are going to provide several large potential moves during the year. Our job—wait for the triggers! Focusing on limited proven performers is part of the Mechanics of Consistency! We’ll cover this topic in this week’s Mid-Week Training session.
Upcoming Webinars: At Active Trend Trading we offer four webinars per week to provide training plus trade and market updates. See the schedule below for the next webinars.
After Market Monday’s—Free Fast Paced Webinar every Monday after the Market closes at 1:10 p.m. PDT. Invitations are posted weekly at: https://www.facebook.com/ActiveTrendTrading/
How to Make Money Trading Stock Webinar—Free Webinar every Friday at 11:00 a.m. Pacific Time. This weekly live and recorded webinar helped traders find great stocks and ETF’s to trade with excellent timing and helped them stay out of the market during times of weakness.
How to Make Money Trading Stocks on Friday, June 9th
Register now for the next live webinar at the link below:
Register Here: https://attendee.gotowebinar.com/register/7568057664238913027
Time 11:00 a.m. PDT
Next Training Webinar: May 31st
For Premium Members, our Wednesday evening training is developing some fantastic traders
Topic: Swing Trade or Trend Trader or Both?
** Friday’s “Final Hour” **
Time 12:00 p.m. PDT
For Premium Members, provides trades and set ups during the final hour of weekly trading.
Managing Current Trades: Positions open in Strategies I, II & III. Allocation adjustments were made this past week to account for profits earned YTD. Allocations will be readjusted towards the end of August in preparation for 4th quarter. These adjustments are important to assure compounding objectives are met as trading campaign progresses along.
Strategy I: One position Open GRUB
GRUB: Opened at 43.84 on 5/26
UCO (Closed last week): Opened at 15.69 on 5/8/17; Closed ½ position on 5/12 for 5.16% gain or Profit = $162.00; Closed ½ on 5/24 at 6.69% gain or Profit = $210.00; Total Profit = $372.00
Strategy II Basic Options: Waiting on new set up
For members wanting to better understand this Strategy there is a very good training video at: https://activetrendtrading.com/basic-option-strategy/
Strategy III Wealth & Income: Foundation positions are open in SPY and NVDA. Total capital for Strategy III = 9.08% or $12.19K.
SPY: Waiting for setup
NVDA: Waiting for setup
TSLA: Closed TSLA with 100.5% Gain
NUGT: LEAPS Straddle Closed—Position not achieving cashflow. Too much effort for the payoff. Trading directionally with the Gold ETFs much more efficient.
Results last week:
SPY: Loss = -$271
TSLA: Profit = $500
Running Performance premium collected plus residual value of LEAPS
SPY: +18.12%
NVDA: Opened 5/26
TSLA: +100.5% – Closed – 5/26/17
NUGT: +1.37% – Closed – 5/1/17
Combined: 57.88
Closed TSLA on 5/26 for 100% gain between premium collected and residual value of the Jan 18 Straddle. Initial capital investment was $14,230 for the 2 contract Straddle. The Straddle was sold for $23,280. Add in the $5,251 collected in Premium since Jan 2017 and the total value of the trade was $28,531. I will wait approximately 2 weeks before opening a new TSLA position.
Opened NVDA Jan18 140 Straddle on 5/26/17 and will sell weekly premium against this position. With only ½ of the year remaining I will adjust my expectations to a 50%-65% return on this position.
Tip for Experienced Option Traders: Occasionally after a weekly trade goes against me but the trend appears to be changing I will add one naked contract over and above my foundation position and close this out after it gains at least half of the premium I’ve collected. Doing naked options is not for everyone and I keep my risk small by only doing one contract above my covered limit. In other words, if I can sell 4 contracts covered by my long leaps I’ll sell one additional. This helps hedge the losses a bit but it this tactic is not without risk and must maintain a tighter stop than I would normally use with the regular position.
Note: We do our best to get both text alerts and email alerts out in a timely manner, occasionally there will be trades that are missed because of delay in the Text or Email alert applications. Additionally, please double check with your broker to assure they allow spread trades like we do with Strategy III. Some do and some don’t.
Additionally, it is crucial when selling premium against the Long LEAPS position that the premium collected cover the weekly cost of holding the LEAPS plus an additional amount to over this amount as a gain. This is one of the reason I sell premium of weekly options that are close to be “At the Money”. I base my selling on the expected move during the next week. If one is not bringing enough weekly premium this trade will not work out as well and may wind up being a losing trade.
Several members have asked about this strategy and a more detailed explanation is available in this updated video at: https://activetrendtrading.com/wealth-and-income-strategy/
I posted a video about how to choose the weekly options too short for this strategy. It can be viewed at: https://activetrendtrading.com/videos/
Additionally, some of these trades may be selling weekly puts on up trending stocks. If you are interested in parallel trading this strategy register at this link: http://forms.aweber.com/form/99/1278533099.htm
Early Warning Alerts for Leveraged Index ETFs: Last Trigger: 11/4—Second Chance Entry on 4/18/17 on TQQQ at 85.44. Closed total 4/18 position for an average gain of 6.83%. Waiting new setup.
EWA Account Return for 2017: 5.43%
The Early Warning Alert Service alerted on all market lows in 2016. See the link below for the new video for 2016 that highlights entry refinements that will provide improved entries even in environment like 2016. In 2016, the entry triggers were challenging because of the number of straight off the bottom moves. Mike and I have analyzed this and have tested adjustments in place going forward.
EWA 2016 Update Video: https://activetrendtrading.com/early-warning-alerts-update-for-2016/
Potential Set Ups for this week: Opened position in GRUB on Friday based on a rebound and trend line breakout. Look for pullbacks to 8/20 day EMA’s to potentially add to the position. ESNT, LOGM and CC are pulling back. Wait for TSI Tick-up Trigger.
TLSA: Waiting for a setup to the upside. Price action approaching resistance at a 327.76 level. Price has formed an ascending triangle on a daily chart. Remember there are two upside targets $330 and $380 based on a measured move and analyst’s target. Use 8/20 day EMA’s for support markers for potential trades. Looking to open positions in all 3 Strategies.
Gold: Tends to rally in June or July with the rally lasting until late August or early September. This coincides with the seasonal weakening in the dollar. Last year NUGT rose of 150% during this rally. While we do not know if a similar move will take place this year, I will look for buying opportunities during the May, June and July basing period. Between now and July I would like to see Seasonality kick in. Then I will enter up to a double position. Watch and be patient.
Financials: Tends to rally through the end of April, but has lagged this year. Price is looking for support at the 100-day moving average so a move up through the end of April may take place. The biggest move in the Financials tend to take place in October. Last year FAS moved over 50% from late October through the end of the year. As of 5/26 FAS looks promising.
Biotech’s: Tends to rally in June-July through the end of the year. IBB is showing a reversal from a lower high. Last year LABU provided two 80% moves between June and December. Current prices are stuck in horizontal channel so watch support and resistance bounces.
Oil: Tends to rally after February, but not this year. Oil has not been following the seasonal pattern. Last year UCO had multiple runs of over 40% between April and December. Currently price is stuck in a range on UCO between the 15 and 24 levels.
Indexes: Covered in General Market Observations
Mike’s Macro Market Musings: Title: Technical tip – Can A Red Candlestick Be Bullish? And A New Macro Valuation Metric
I know that usually these articles address more macro considerations related to the equity markets, but they don’t always have to be that way. I may occasionally digress, as I here for a short while
When first learning about candlesticks and how to interpret and utilize them profitably, it is normal to be drawn to simplistic summaries of their characteristics. Such as the axiom presented to me when first wading into the waters of candlestick analysis that red candles are bearish and green candles are bullish. Is that really true? The answer, as with much else in life, is that it depends, and context is crucial. The short answer to this question is that indeed a candle can be red and bullish or green and bearish. However, this happens only in certain situations.
It is undeniably true that a green candlestick means that the time period represented closed higher than it opened, and vice versa for a red candle. One of the facets of candlestick analysis is that the size and location of the shadows or the wicks is important. This is an important factor that indicates and denotes bullishness or bearishness irrespective of the color of the candle.
 A candle with a long wick to either side with a relatively small body is usually bullish or bearish irrespective of its color. So, a candle with a long wick above its body and with a relatively small body is generally bearish irrespective of its color, and conversely, a candle with a long wick below it with a relatively small body is generally bullish irrespective of its color.
As with real estate, location (or context) is important. For example, after a period of selling as denoted by a series of candlesticks with lower highs and lower lows, the appearance of a candlestick with a small body and long lower wick (sometimes referred to as a “hammer” candlestick or a “bullish rejection” candle) is often a pretty reliable indication that the selling pressure is easing and buyers are stepping in and taking action in the price zone depicted by the lower wick, regardless of the color of the body of the candle. Doesn’t matter what you call it, the candlestick is telling you very clearly what happened during that time period and showing price support in the area of the lower wick. This happens to be one of my personal favorite set ups. Utilizing this information, one can pretty comfortably place an order to buy the entity anywhere in the price range of this candlestick to slightly above the high of the candle with a hard stop loss (assuming your buy order is filled) just below the low of the lower wick. The risk of the trade in this case is very well defined and position size can be established accordingly.
Let us look at why this is so and understand the market dynamics behind it. A candle with a long wick to either side is generally called a “rejection candle” in technical analysis terminology. This is because such a candle indicates that prices were pushed up or down relatively substantially during the course of a session from its open, but this level that prices were pushed up or down to, was rejected by the market and the session closed in the vicinity of its open.
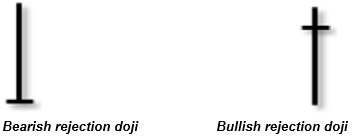 A special type of candle, commonly known as a doji, is one in which the open and the close were more or less at the same level. Thus, a doji is a candle without a ‘real body’ per se. The market dynamics entailed in a doji with a long wick to either side is similar to that described in the previous paragraph and thus a candle without a real body and thus devoid of color, whether green or red, can be a rejection candle as well. Therefore, a doji with a long wick below the open and close is generally bullish, and one with a long wick above the open and close is generally bearish.
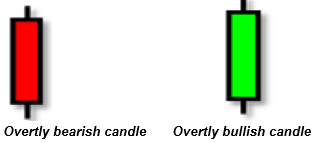 The identification of bearish and bullish candles, in my opinion, is a key component of technical analysis, and it is frequently used to identify and specify an entry point to join a trend. Some candles are overtly and obviously bearish and bullish, such as those where the open is at the top or bottom quarter of a range, with the close being in the bottom and top quarter of a range respectively; in other words, candles with a red or a green real body and with relatively small wicks.
By teaching yourself what a bullish or bearish candle looks like and what it depicts in terms of market sentiment and price action during the period the candle represents, and not worrying too much about what a candle is officially called, can help you to define entry and stop loss points as part of your trading strategy.
New Valuation Metric: I just learned today of a valuation metric for the market indexes of which I have not been previously aware and want to pass it along to those who might be interested. It makes a lot of sense and presents some fantastic buy signals for the overall market although those signals don’t come along very often. However, when they do, they are powerful and need to be heeded.
This metric is simply the ratio of the P/E ratio of the S&P 500 to VIX and is illustrated in the following chart which I present for your perusal:
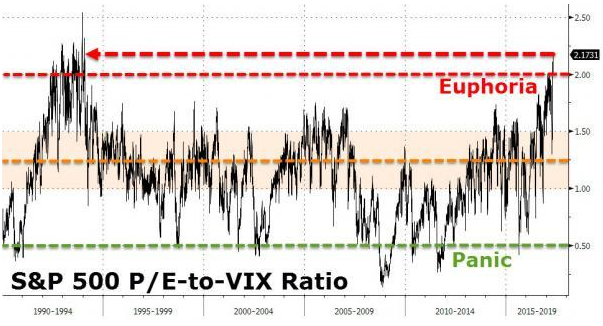 Note what happens when this ratio drops to 0.50 or lower (the “panic zone”), which last occurred early in 2016 during the heavy selling in January and February – powerful intermediate to longer term market rallies. The P/E utilized for this metric seems to be the non-GAAP 12-month trailing P/E for the S&P, currently reading around 21 since VIX is currently around 10 and the ratio is now approximately 2.1. Note also that this ratio is now approximately 20% higher than it was at the height of the dot com boom in early 2000. To me, this indicator seems to work better as buy signal for deeply oversold general market conditions and perhaps not so well as an indicator for overbought and/or overvalued conditions. Use it as you see fit. Another tool for your toolbox.
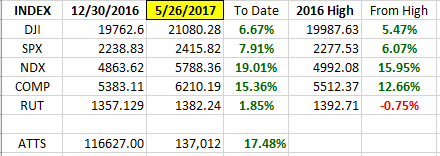
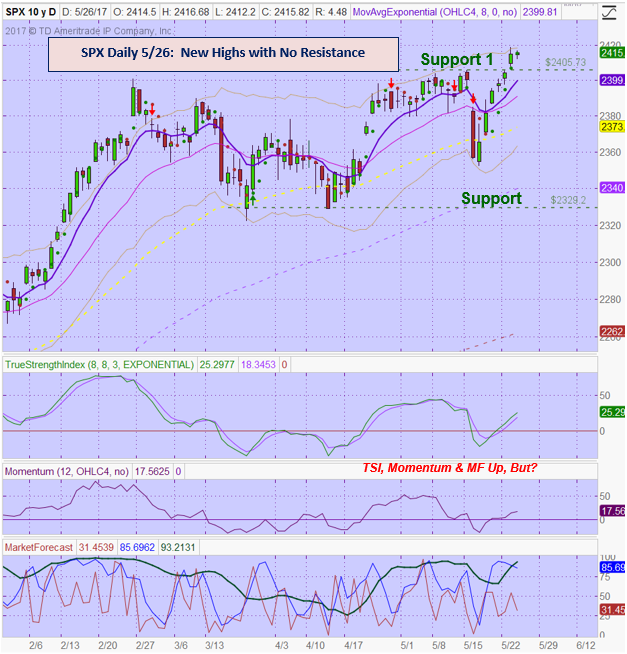
General Market Observation: Why the positive move at the end of last week? Potentially the Fed’s outlook on future rate increases or maybe it was the Globalist view of President Trump on his first world visit. Quite amusing the contortions evident on the face of world leaders who do not share the same view as the President. Whatever the true reason—and maybe there really isn’t a real reason—the S&P and NDX pushed to new high territory. For each of these Indexes there is no overhead resistance from past price action so they are both in the clear air zone.
Both Indexes are showing negative divergence between price action and momentum oscillators. Continue to trade Index Pullbacks until the stop working!
RUT: The Russell provides a more interesting chart. Price weakness is evident when compared with the other Tracking Indexes. Price action on the RUT has been stuck in a 3.3% range since mid-December last year. With the makeup of the RUT inclusive of more small cap stocks is the economic environment currently not healthy for budding companies? Recognizing that the other Tracking Indexes are weighted in favor of the Big Cap (FANG and a few others) are we seeing a condition similar past years where weakness in the RUT eventually led to a meltdown in the other Indexes? At this point we don’t know and time will tell. Moving forward until proven different. I am looking for a big end of year run in the RUT to bring it back in to range of the other 2 Tracking Indexes. Until then trade support and resistance bounces in IWM or the TNA/TZA combination until October.
 SPX: Downside Market Short the SPY, SPY Puts or SPXU.
Preferred Long ETF’s: SPY, UPRO and SPXL
NDX: Downside Market Short the QQQ, QQQ Puts or SQQQ.
Preferred Long ETF’s: QQQ and TQQQ
RUT: Downside Market Short the IWM, IWM Puts or TZA.
Preferred Long ETF’s: IWM and TNA
How to Make Money Trading Stock Webinar—Free Webinar every Friday at 11:00 a.m. PDT. This weekly live and recorded webinar helped traders find great stocks and ETF’s to trade with excellent timing and helped them stay out of the market during times of weakness.
How to Make Money Trading Stocks on Friday, June 9th
Register now for the next live webinar at the link below:
Register Here: https://attendee.gotowebinar.com/register/7568057664238913027
Time 11:00 a.m. PDT
To get notifications of the newly recorded and posted How to Make Money Trading Stocks every week subscribe at the Market Tech Talk Channel: https://www.youtube.com/c/MarketTechTalk
Index Returns 2017 YTD
ATTS Returns for 2017 YTD Closed Trades
Percent invested adjusted of $134.2K account: Strategies I & II invested at 9.7%; Strategy III invested at 9%.
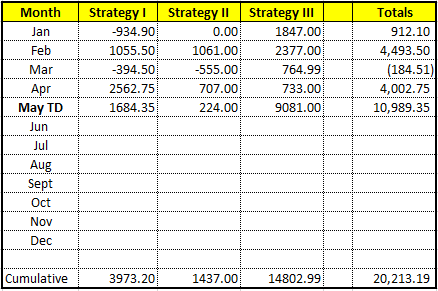
Current Strategy Performance YTD (Closed Trades)
Strategy I: Up $3973.20
Strategy II: Up $1437.00
Strategy III: Up $14802.99
Cumulative YTD Closed & Opened: 17.58%
Active Trend Trading’s Yearly Objectives:
- Yearly Return of 40%
- 60% Winning Trades
- Early Warning Alert Target Yearly Return = 15% or better
For a complete view of specific trades closed visit the website at: https://activetrendtrading.com/current-positions/
Updated first full week of each month. The next update after first week in June.
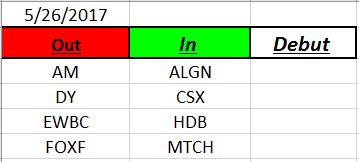
Outs & Ins: No new adds to IBD 50 on 5/26. Strongest Fundamentals include: LOGM, CAVM, COHR, MELI, LRCX and AMAT. LOGM is bouncing off the 50 day EMA.
Share Your Success: Many of you have sent me notes regarding the success you are having with the Active Trend Trading System. Please send your stories to me at dww@activetrendtrading.com or leave a post on the website. Thanks.
