Good Day Traders,
Hope everyone joins us for this week’s Mid-Week Market Sanity Check Training. I’ll be sharing some of the hidden benefits of analyzing an Intraday One Hour Chart without the need to watch it all day long! These hidden benefits can greatly improve daily and even weekly entry and exit timing. Don’t Miss It!
General Market Observation: This week’s Market Observations and How a Bearish Trade on the Index ETF’s may be setting is provided on the following video: Click Here or see it at:
https://activetrendtrading.com/videos/
Mike’s Macro Market Musings: Jaws of Life and Death
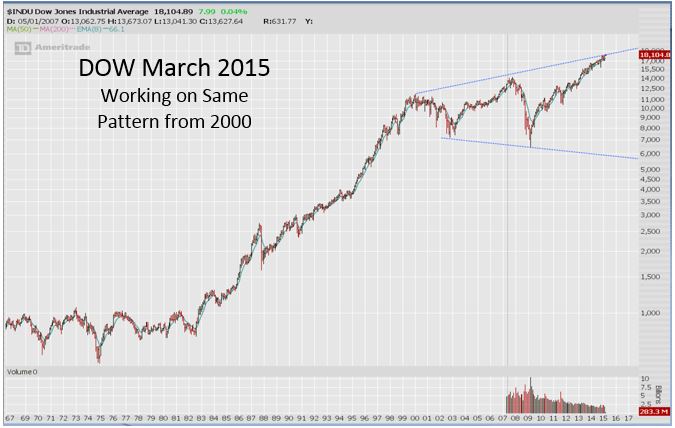
Mention has been made in a few recent ATTS webinars of megaphone technical chart patterns (aka broadening top or bottom patterns) currently evident in charts of the indexes ranging from daily charts to longer term monthly charts. These are relatively rare patterns for the indexes and therefore worthy of note when they form. After prolonged periods of selling, a megaphone bottoming pattern can have strongly bullish implications of accumulation and loss of selling momentum. As topping patterns after prolonged bouts of buying, their implications can be quite bearish. I don’t think anyone can reasonably argue that in the six years since the indexes bottomed in March, 2009, we’ve had anything but a very prolonged period of buying in U.S. equities.
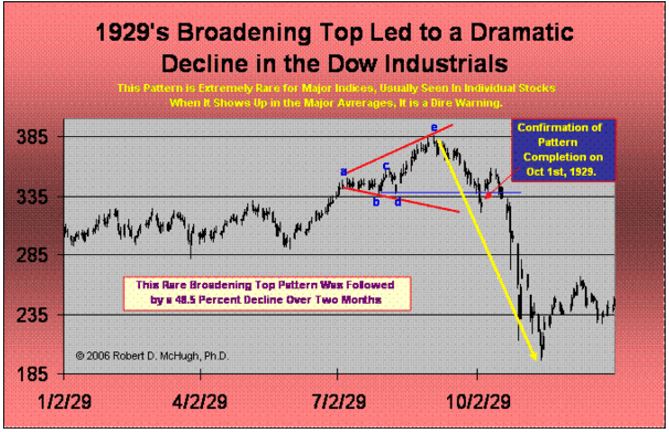
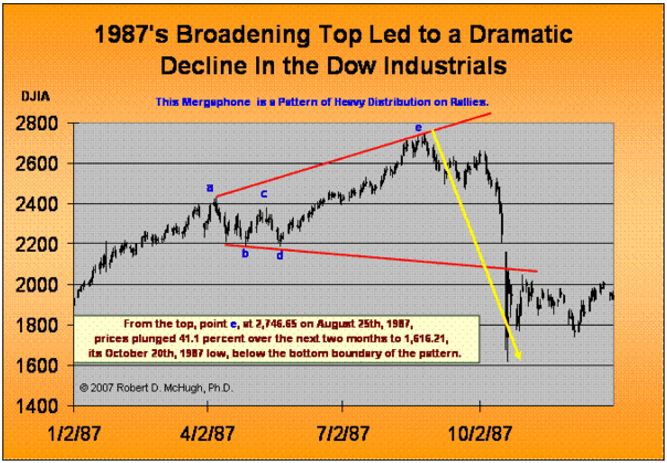
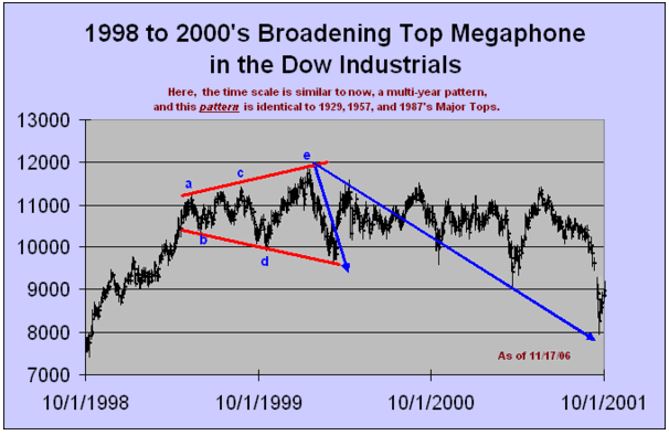
Many of the major stock market tops of the past century were marked by a Broadening Top pattern. This pattern, which also looks like a set of jaws, is uniquely characterized by two mirroring boundary lines. The top boundary line is ascending; the bottom boundary line is descending. What is amazing is that each boundary line has nearly the same slope, one rising, the other falling. The same pattern is currently evident in the charts of the Dow, the best example among the major indexes at this time. The lines are formed by simply drawing trend-lines connecting the peaks and connecting the troughs. Each line is formed by connecting at least 2 points. In other words, neither boundary line is manufactured by a biased analyst. Rather, it is formed where the market decided to top and bottom along its path to a major top.
What are the odds that the slopes of these trend-lines would be exactly the same? What are the odds that seven of the greatest market tops of the past century in the Dow Industrials would bear the markings of this pattern? This is not random. This is a normal pattern of distribution and market buying/selling psychology that naturally leads to major tops, and subsequent declines ranging from 10 percent to 40 percent over a period from a month to 11 months. These patterns were found in 1929, 1957, 1965-66, 1972-73, 1986, 1987, 1998-2000, 2004-2008. These were major topping patterns preceding swift and substantial market downturns in 1929, 1987, and 2000-2002. As always, graphics can be quite illustrative:
It could be considered a fool’s errand to try to predict when the next significant market downturn will begin, how long it will last, or how far it will go, and there is certainly nothing imminent on the near term horizon. But unless one truly believes that somehow this time is different than the others, one of the great lessons of history is that many people do not learn the lessons of history. And, as we know, even if history doesn’t always exactly repeat itself, it often rhymes.
_________________________________________________________
If you have not had a chance to check out the research Mike Trager and I have done to start the EWA service you can find a short 10 minute preview at: http://youtu.be/MgC9GMAWh4w
If simplifying your life by trading along with us using the index ETF is of interest you can get the full background video at: https://activetrendtrading.com/etf-early-warning-alerts-video/
Remember if you are a premium or Early Warning Alert member you can receive Text Alerts and Trade Notifications if you send us your mobile phone number. Sent us your number with NO HYPHENS please and we’ll get you on the Text Notification List.
The How to Make Money Trading Stock Show—Free Webinar every Friday at 10 a.m. PDT. This weekly live and recorded webinar helped traders find great stocks and ETF’s to trade with excellent timing and helped them stay out of the market during times of weakness.
The “How to Make Money Trading Stocks” Show is back this Friday, March 13th
Ensure you get a seat by registering now at: https://attendee.gotowebinar.com/register/7527620907123503873
To get notifications of the newly recorded and posted Market Stock Talk every week subscribe at the Market Tech Talk Channel: https://www.youtube.com/channel/UCLK-GdCSCGTo5IN2hvuDP0w
- The Active Trend Trader Affiliate Program is ready. For more information or to become an Affiliate please register here: https://activetrendtrading.com/affiliates-sign-up-and-login/
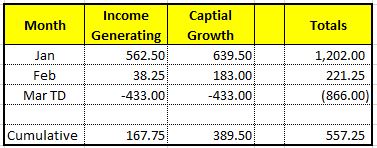
Summary of Monthly Closed Trades as of the March 6th:
1% invested.
Total Booked Profits since Jan 1 when the timing service began: $ 557.25
_______________________________________________________________
ATTS Returns for 2015 through March 6th
Margin Account = +0.5%
IRA Account = +3.5% (currently trading the IRA with the same rules but have been testing out the Option Strategies we’re introducing this week)
Early Warning Alerts = +1.97%
Active Trend Trading’s Yearly Objectives:
– Yearly Return of 40%
– 60% Winning Trades
For a complete view of specific trades closed visit the website at: https://activetrendtrading.com/current-positions/
Updated at the beginning of each month.
For our all Active Trend Trading Members here’s how we utilize our trading capital
Trading Capital Setup and Position Sizing: Every year we start the year off trading a $100K margin account make the math really easy for yearly returns.
- Each trader must define their own trading capital in order to properly size trade positions to their own risk tolerance level!
The $100K account is split between up to 4 stocks and a leveraged Index ETF. Actual number of shares will vary of course depending on price of the entity traded. We have found that limiting open positions to only 5 entities greatly reduces the trade management time requirements for members. This goes back to our goals of providing a system designed for members who work full time.
- Regardless of market conditions no more than 50% of available margin is used at any time.
- Each Trade is split 50-50 between Income Generating & Capital Growth Objectives unless specified in the Order Alert
- Naked Puts or short term options strategies will be used occasionally for Income Generating Positions
- None of the trade setups are a recommendation to trade only notification of planned trades from set ups using the Active Trend Trading System. Each trader is responsible for establishing their own appropriate risk level on every trade.
Managing Existing Trades: The month of March has just about stopped out all of the Oil related position. GLOG stopped out early in the week and OIH is looking weak and is very close to its stop. We use hard stops when a trade is initially entered for situations when price goes where it shouldn’t go. While giving a position room to breathe is advisable when we enter on a rebound and the rebound fails we get out quick and minimize risk to trading capital. Even if both of these trades fail, the risk to total trading capital was less than 1%!
Pre-Earnings Trade: Earnings season is winding down but there are a few stocks reporting this week that could provide some surprises. These include: BITA, QIHU and HABT. We nibbled a bit on HABT when it appeared to be moving into the pre-earnings run that failed. So I’m now waiting until after earnings on Tuesday unless there is a pullback to support around the 50 day MA. If there is a setup and a position opened it will be closed on Tuesday before the market close.
Potential Set Ups for this week: Market weakness over the last few days has resulted in several stocks pullback but none have completed their pullbacks.
Upside: Several charts look promising this week, but the overall market movement will determine entry viability. AMBA will be interesting at the breakout level of 63.20 where it bounced on Friday. If prices break through this level then a rebound back up through the level might offer an opportunity. At this point the indicators on the daily chart look like a pullback and consolidation could be underway. VIPS and XRS are holding up well also. Watch how they behave around the moving averages and both need a boost in Momentum to breakout of their current consolidation.
Downside: Four past leaders make the downside list again. GMCR, TSLA, BIDU and potentially VDSI.
Toss Ups: Stocks that could go either way include: GILD, AFSI, FLT & ALK. ALK was looking ready to break from consolidation last week and fell back on Friday. It maintained its uptrend line but just barely!
Leveraged Index ETFs: If the Indexes continue to weaken I will look to trade the non-Leveraged Index ETF’s to the downside. Brokers have different rules on shorting the Leveraged Index ETF’s so in order to provide set ups that can be traded in most accounts including IRA’s I’ll focus on the Non-Leveraged ETFs and the Put Options available with an April expiration month.
Comments and opinions written below this line of text may be provocative and only obliquely related to trading. Some may find these “Off the Wall” comments challenging to their outlook on life. I will not post any comments made on subject matter below this line, so if you disagree blast away.
OFF THE WALL
Off the Wall: Take a breath! This is the advice I often give to the high school golfers I help coach. Often they get so tense especially if they are just learning to play. All the thoughts going through their minds about how to grip the club, how to stand, what the swing should feel like and of course wanting to perfectly knock the heck out of that little white ball!
Some of these kids literally hold their breath as they prepare to strike the ball. This in turn increases their tension. Part of the reason they do this is because they want to hit the perfect shot with the perfect swing. What happens—the extra tension degrades their abilities and increases the probability that they will hit an ugly shot. It takes time for these fledgling golfers before they realize that perfection is rarely achieved in golf. The fact is that golf is a game of managing mistakes and not letting mistakes compound. If the first shot goes in the deep rough learn to get the ball back onto the fairway. Trying the low percentage miracle shot rarely works! The more skillful the player the better they manage their mistakes! This also include living with the outcome of each shot.
You know trading is a lot like golf!
Share Your Success: Many of you have sent me notes regarding the success you are having with the Active Trend Trading System. Please send your stories to me at dww@activetrendtrading.com or leave a post on the website. Thanks!
