Good Day Traders,
Overview & Highlights: Based on the feedback from members, the added features of “The Final Hour” webinar and trade alerts the night before the order is placed are working well for Premium members. Additionally, a new tab has been added to the website where anyone can check to see what open positions and monthly trade results. This will hopefully make checking current status more efficient for your busy schedule.
Great article from Mike Trager tonight. Mike covers the historical market tendencies during various presidential cycles including elections. Being aware of these tendencies can help traders manage expectations and be prepared for seasonal effects.
Webinars: At Active Trend Trading we offer two webinars per week to provide training plus trade and market updates. See the schedule below for the next webinars.
The How to Make Money Trading Stock Show—Free Webinar every Friday at 11:00 a.m. PDT. This weekly live and recorded webinar helped traders find great stocks and ETF’s to trade with excellent timing and helped them stay out of the market during times of weakness.
How to Make Money Trading Stocks on Friday, Oct 28th
Register now for the next live webinar at the link below:
Register Here: https://attendee.gotowebinar.com/register/680637658193062148
11:00 a.m. PDT
Next Training Webinar: Oct 26th
For Premium Members our Wednesday evening training is developing some fantastic traders!
Topic: Getting Ready for End of Year Trading
Managing Existing Trades: Positions open for 3 strategies.
Strategy I Portfolio Building:
Strategy I Weekly Results Week ending 10/21:
NUGT: Profit of $416.00
GRUB: Profit of $118.15
Trade 1: Opened position in NUGT on 10/12 at 11.50
Target 1 = 10% hit on 10/13 sold ½ position for a profit of $262.20
Target 2 = 25%-35% sold 130 shares for a profit of $416.00
Stop Loss = Trailing Stop at 11.50
Trade 2: Opened position in GRUB on 10/13 at 40.60 (Pre Earnings Trade)
Target 1 = Fib Retracement at 41.99; 10/18 hit T1 Sold at 41.99 for a profit of $118.15
Target 2 = 10% or close on 10/25 prior to Market close
Stop Loss = Breakeven
Earnings on 10/26 BMO
Trade 3: Opened position in GIMO on 10/18 at 50.25 (Pre Earnings Trade)
Target 1 = 5%
Target 2 = 10% or close on 10/25 prior to Market close
Stop Loss = 4% from purchase price
Earnings on 10/27AMC
Trade 4: Opened position in BGS on 10/20 at 48.15 (Pre Earnings Trade)
Target 1 = 5%
Target 2 = 10% or close on 10/25 prior to Market close
Stop Loss = 4% from purchase price
Earnings on 10/27AMC
Strategy II Income Generation: 2 Open Position
Trade 1: Opened 1 contract of GOOGL 28Oct 840C at 14.60
Target 1 = $20 or GOOGL at 840
Stop Loss = Close the day of earnings 10/27 AMC
Trade 2: Opened 3 contract of BABA 4Nov 105C at 3.20
Target 1 = $5 or BABA at 109 sell 2 contracts
Stop Loss = Close the day of earnings 11/2 BMO
For members wanting to better understand this Strategy there is a very good training video at: https://activetrendtrading.com/basic-option-strategy/
Strategy III Wealth & Income: Three positions opened
Closed the first TSLA LEAPS Strangle which was opened on 9/28/15 for a 100% profit on 9/2/16.
Strategy III Weekly Results Week ending 10/21:
SPY: Profit of $408.00
TSLA: Loss of $225
NUGT: Profit of $180
Trade 1: Foundation Position is 4 contracts of SPY Jan17 205C and 4 contracts of SPY Jan17 200P Current Trade—Currently Up 32.29%; Premium Collected since opening trade on 1/4/16 = $8,709
10/21 sold 2 contracts of SPY 28Oct 212.5P at 0.65; potential profit $130
10/21 sold 2 contracts of SPY 28Oct 215C at 0.62; potential profit $124
Trade 2: (Long TSLA Jan17 250C & Long Jan17 220—Closed on 9/2 for 100% gain since 9/29) + New Positions Jan17 210C and 220P: Current Position Total Invested $14,900. Currently Up 87%: Premium Collected since opening trade on 9/28/15 = $15,688.50 + New Positions at $5,525.50 = Total Collected $21,214
Waiting for Implied Volatility to balloon prior to earnings on 10/26 AMC
Trade 3: Long NUGT Jan18 18.4C + NUGT Jan18 18.4P opened 9/. 4 contracts each side of the straddle for total investment of $6,720. The required weekly premium to collect each week to achieve a 100% return by Jan 2018 is $191.43 per week.
10/21 Sold 3 contracts of 28Oct 14P at 0.70; potential profit $219
Tip for Experienced Option Traders: Occasionally after a weekly trade goes against me but the trend appears to be changing I will add one naked contract over and above my foundation position and close this out after it gains at least half of the premium I’ve collected. Doing naked options is not for everyone and I keep my risk small by only doing one contract above my covered limit. In other words, if I can sell 4 contract covered by my long leaps I’ll sell one additional. This helps hedge the losses a bit but it this tactic is not without risk and must maintain a tighter stop than I would normally use with the regular position.
Note: We do our best to get both text alerts and email alerts out in a timely manner, occasionally there will be trades that are missed because of delay in the Text or Email alert applications. Additionally, please double check with your broker to assure they allow spread trades like we do with Strategy III. Some do and some don’t.
Additionally, it is crucial when selling premium against the Long LEAPS position that the premium collected cover the weekly cost of holding the LEAPS plus an additional amount to over this amount as a gain. This is one of the reason I sell premium of weekly options that are close to be “At The Money”. I base my selling on the expected move during the next week. If one is not bringing enough weekly premium this trade will not work out as well and may wind up being a losing trade.
Several members have asked about this strategy and a more detailed explanation is available at: https://activetrendtrading.com/wealth-and-income-strategy/
I posted a video about how to choose the weekly options to short for this strategy. It can be viewed at: https://activetrendtrading.com/videos/
Additionally, some of these trade may be selling weekly puts on up trending stocks. If you are interested in parallel trading this strategy register at this link: http://forms.aweber.com/form/99/1278533099.htm
Early Warning Alerts for Leveraged Index ETFs: Last Trigger: 9/14. Waiting new signal or secondary trigger.
EWA Account Return to date: 12.09%
The Early Warning Alert Service hit all eight major market trading points in 2015. See this brief update video for more details: Early Warning Alerts Update Video or at https://youtu.be/GJwXCL4Sjl4
If simplifying your life by trading along with us using the index ETF is of interest, you can get the full background video at: https://activetrendtrading.com/etf-early-warning-alerts-video/
Potential Set Ups for this week: My plan for this week is to wait for support and resistance bounces on the Indexes. Secondly I’m not going to rush any trade on Monday and will wait for the stock to complete their current pullbacks or consolidations. There are good candidates pulling back. There are 4 positions opened for Strategy I and the order listed below for THO will fill the quota of 5 stocks for this strategy.
I still like NUGT off identifiable & established levels of support. This is a highly volatile ETF for gold miners. The ideal way to trade it is to know how much it usually runs after a bounce and then plan to take profits during the run not at absolute profit projections. Using this strategy should open the door to profits in the 10%-25% range within a very few days. So we will have to be quick. Mid-week I will provide an in depth analysis of NUGT covering why I think this is a good trading candidate.
Pre-Earnings Trade: The following candidates may provide some Pre-earnings opportunities: GRUB (open position), GIMO (open position), BABA, MOMO, SIMO, MXL, CPE and NVDA.
Trades for Week of 10/23
Strategy I – THO
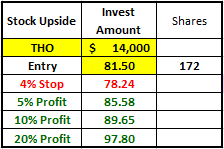
Order to buy 170 Shares of THO between 81.30 x 81.50
Condition: Pullback towards 50 day EMA at 80.94
ENTRY: Order to buy between 81.30 x 81.50
Limit: Stop Limit 81.30 x 81.50
EXIT: Sell ½ position at T1 = 5% – 10% gain
T2 = Between 15% – 25%
Hard Stop = 4%
ADDITIONAL INFO/Condition
– Day Order
– If filled set Stop Loss & Profit target exits GTC
Mike’s Macro Market Musings: Presidential Election Cycles
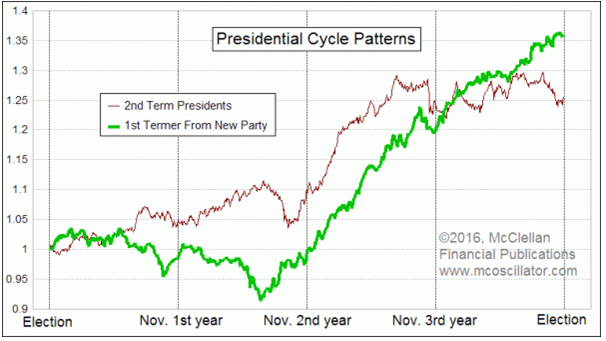
Now that the “presidential” debates have concluded (neither candidate seems especially “presidential” to me, but that’s a very different topic for discussion) and the election is less than three weeks away, it might be interesting to direct some attention to what might be expected in the equity markets going forward. There are many different cycles that can be observed historically in U.S. equity markets and the presidential election cycle is one that has shown some consistency over several decades, albeit with the understanding that nothing is ever completely 100% predictive. Consider the following chart:
One important point to note is that there is a difference in the market’s behavior depending on whether the incumbent party wins, or whether the new challenger party candidate wins.
The chart above shows two different versions of our Presidential Cycle Pattern, based on which type of president is in office. I don’t mean which party, but rather the differentiation is over whether the president is from a different party than the last term. For those rare instances when the same party is in office for a 3rd term (i.e., this would be the situation should Clinton prevail), I count that as a 2nd term president.
The reason for differentiating this way is that when a new president from a different party takes office, historically they have spent the first couple of years “discovering” that conditions are even worse than he told us during the campaign, and that the “only solution” is whatever package of taxes, spending, or regulatory changes it is that he is proposing. This can create uncertainty in the financial markets and the markets dislike uncertainty to a very large degree. Hence we can observe in the chart above that when a first term president from a new party (this year that would mean Trump) is in office, introducing new policies that have yet to be proven, there tends to be a noticeable downtrend in the equity markets that can persist for nearly two years post-election, eventually reversing into a very strong uptrend during the third and fourth years of said term. When the incumbent party prevails, and retains the presidency (this year that would mean Clinton), the overall trend during those first two years appears to be somewhat sideways with a slight upward bias. In either case, the third year of the presidential cycle shows a highly favorable and strong uptrend.
And election years are different when the incumbent is not running for re-election, as is the case right now. Investors face the certainty of getting an unknown, and investors don’t like unknown risks. So, the market tends to do worse in election years with no incumbent running.
So, how can we practically apply this information to our trading and investing? If Trump manages by some miracle to become our next president, we can reasonably expect a market decline and an overall downward bias in the equity markets for maybe 18 – 24 months’ post-election, an environment in which rallies should be sold into and bullish trades have limited upside potential. Should Clinton prevail, expect more of what we have seen most recently, an overall sideways trend with possibly a slight upward bias that may be limited by the historically high equity valuations currently present. Either way, expect a very strong uptrend to begin in the late summer or early fall of 2018 which could last for a year or more, an environment in which buy and hold investing works extremely well and declines tend to be brief and shallow and should be vigorously bought.
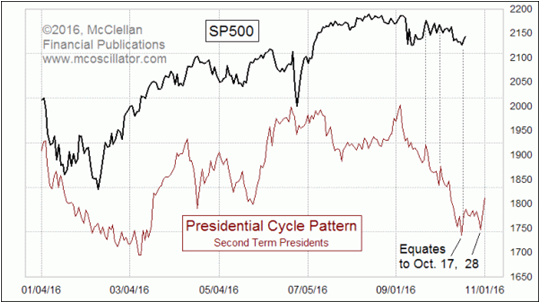
In a previous column, I noted how the market has a very strong historical track record over a period of many decades of predicting the outcome of presidential elections with an 86% accuracy rate (again, nothing is ever 100%, but 86% is pretty strong). To wit, should the market decline during the 3 months immediately preceding the election, the non-incumbent party (this currently refers to the Republican party and Trump) usually prevails, and vice versa should the market advance during that time period. Given the overall sideways trend, or lack of trend, in equity index price action since early August as seen in the Dow and S&P 500 (with perhaps a very slight downward bias), the market currently (in late October, 2016) seems to be indicating that the election result is too close to call and could go either way, despite any poll results on any given day. The very slight downward bias the past several weeks may perhaps be an early “tip of the hat” to Tru.mp, who has recently indicated a willingness to accept and not question an outcome in his favor.
As Dennis likes to say, we’ll see what happens. The final result is likely to upset as many people as it pleases. Regardless of the election outcome, the above information should help you prepare for either eventuality and not be surprised should the U.S. equity markets “dump with Trump”.
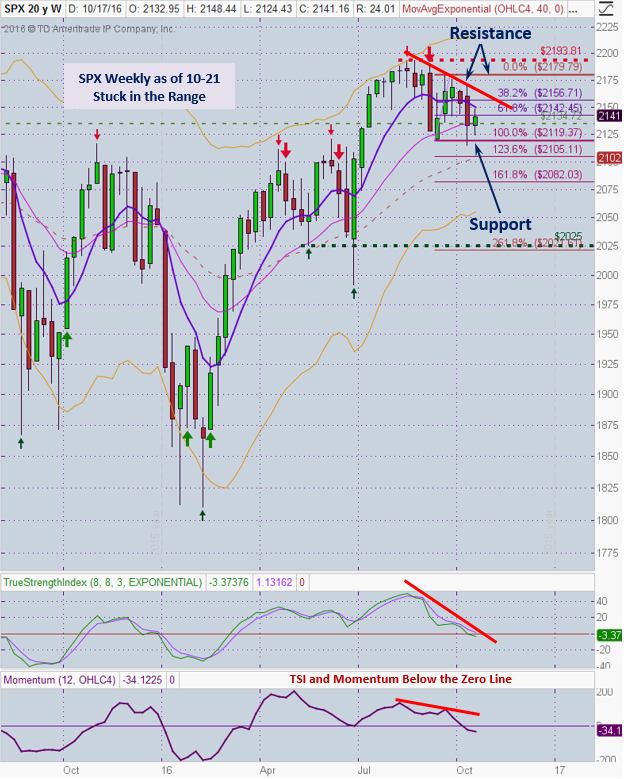
General Market Observation: Last week the Indexes finished in the lower part of the trading range for SPX. The NDX looks ready for a run back towards the highs at the 4900 level. The RUT finished Friday with a hammer off support at 1210. I’m looking for each of the three Tracking Indexes to continue working within the established support/resistance zone. Waiting for extremes is the challenge as the next Fed meeting draws near. Even though the November Fed should be a non-news event, noise surrounding that meeting may move the market quickly either up or down.
I like RUT and TNA on any retest of Friday’s hammer. While the RUT will react most violently if when interest rates are raised, until then there may be quick tradable swing soon.
SPX: Downside Market Short the SPY, SPY Puts or SPXU.
Preferred Long ETF’s: SPY, UPRO and SPXL
NDX: Downside Market Short the QQQ, QQQ Puts or SQQQ.
Preferred Long ETF’s: QQQ and TQQQ
RUT: Downside Market Short the IWM, IWM Puts or TZA.
Preferred Long ETF’s: IWM and TNA
The How to Make Money Trading Stock Show—Free Webinar every Friday at 11:00 a.m. PDT. This weekly live and recorded webinar helped traders find great stocks and ETF’s to trade with excellent timing and helped them stay out of the market during times of weakness.
How to Make Money Trading Stocks on Friday, Oct 28th
Register now for the next live webinar at the link below:
Register Here: https://attendee.gotowebinar.com/register/680637658193062148
11:00 a.m. PDT
To get notifications of the newly recorded and posted How to Make Money Trading Stocks every week subscribe at the Market Tech Talk Channel: https://www.youtube.com/c/MarketTechTalk
– The Active Trend Trader Referral Affiliate Program is ready. For more information or to become an Affiliate please register here: https://activetrendtrading.com/affiliates-sign-up-and-login/
Index Returns YTD 2016
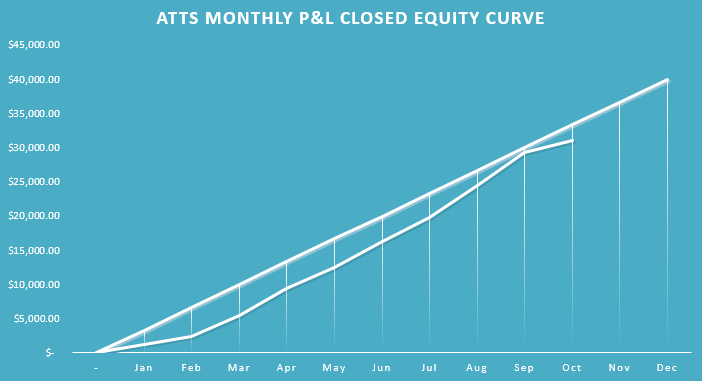
ATTS Returns for 2016 through Oct 7, 2016
Percent invested initial $100K account: Strategies I & II invested at 25.0%; Strategy III invested at 20%.
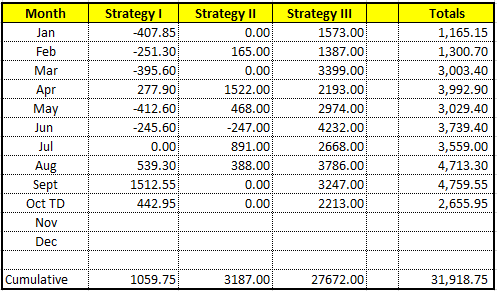
Current Strategy Performance YTD (Closed Trades)
Strategy I: Up $1,059.75 or +1.5%
Strategy II: Up $3187.00 or +3.18%
Strategy III: Up $27,672.00
Cumulative YTD: 31.92%
Active Trend Trading’s Yearly Objectives:
– Yearly Return of 40%
– 60% Winning Trades
– Early Warning Alert Target Yearly Return = 15% or better
For a complete view of specific trades closed visit the website at: https://activetrendtrading.com/current-positions/
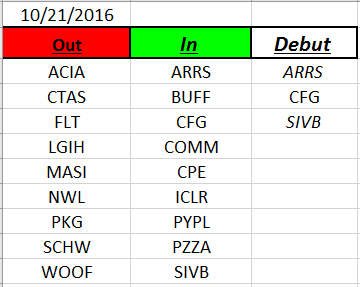
Outs & Ins: ARRS, CFG and SIVB make their debut on this week’s IBD 50 list. ARRS reports earnings on 10/26 AMC and the other two financial stocks reported last week and are extended on a daily and weekly basis. If either CFG or SIVB provide a pullback they may be worth a look because each could run over 10% back to their previous highs.
Earnings are still upcoming for most of the IBD 50. We have open positions in GRUB, GIMO and BGS in expectation of a pre-earnings move up. NVDA, MXL, CPE, BABA and MOMO look like a potential pre-earnings trades. THO has already reported and in the process of consolidating.
Share Your Success: Many of you have sent me notes regarding the success you are having with the Active Trend Trading System. Please send your stories to me at dww@activetrendtrading.com or leave a post on the website. Thanks.
