Good Day Traders,
Today we have a real treat with a special mid-week edition of Mike’s Macro Market Musings. Neither Mike nor I intend to be bearish we’re simply sharing with the Active Trend Trading Members how we are seeing the convergence of clues in the current market environs.
_______________________________________________________________
Mike’s Macro Market Musings: The Chart the Fed Doesn’t Want You To See
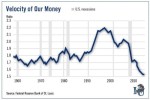
I am well aware of the alarmist tone and context of my recent writings about where the U.S. equity markets are and where they may be heading in the intermediate term future, and I also am well aware that I may have a very contrarian outlook and that there are usually two sides to every coin and consideration. So what is the case to be made for an intermediate term continuation of the bull market in U.S. stocks that is now in its seventh year? The FOMC is well aware of the following chart and its implications – after all, it comes from their own staff economists.
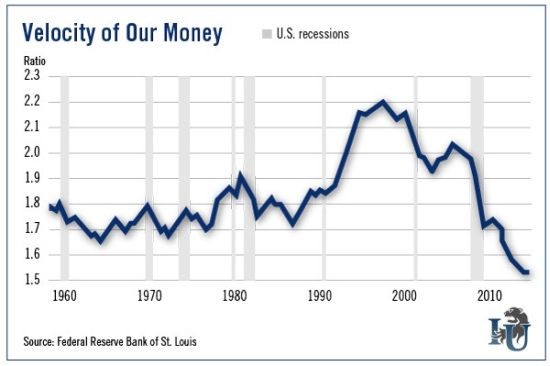
What is this chart telling us? The chart is really quite simple. It shows the so-called velocity of our money – how deep and quickly every dollar we spend flows into the economy. For example, when the ratio climbs above 2.0, it tells us every available dollar in a preset period is spent more than twice. When the ratio dips, we’re spending less. The chart tells us you’re not spending much… and neither is your neighbor. This is a graphic representation of how and why economic growth in the U.S. is as anemic as the recent GDP report for the first quarter of 2015 depicts it to be. In fact, the velocity of our money is the lowest on record going back well over 50 years. It means that instead of quickly using all those cheap dollars the Fed printed to buy cars, boats, and hotel rooms, we’re holding onto them (which explains our seven-year bull market). They’re not flowing through the economy, stimulating organic economic growth, they’re flowing instead into the financial markets. The inflation the Fed has hoped to create is thus happening not in the general economy as the Fed had projected, but in financial asset prices, be it stocks, bonds, or real estate.
The bottom line here is all of that free money the Fed has created out of thin air and pushed into the markets is not having the intended effect. The chart proves it. It’s certainly inflated the equities and bond markets, but it has yet to spark sustained economic growth. It means Ms.Yellen and her troops at the Fed have their hands tied. They can’t raise interest rates by any worthwhile amount given the anemic status of the general economy. Because of this fact, expectations for a rate increase have continually been pushed back over the last 24 months and may very well continue to be pushed back. Don’t forget that at this time two years ago most economists expected rates to be far higher than they are today. Instead, long-term rates are threatening to drop even further. And, worse yet, they’ve turned negative across the pond (a phenomenon once thought impossible).
The Fed very well could raise rates this year. But it will be a token move at best, a mere fraction of the original plan. It may not have a material effect on the economy or the markets. Should the markets throw a hissy fit over a token rate increase it is highly likely the rate increase could be almost immediately reversed? At this point in time, the bullish argument is that a continuation of zero interest rates, or historically low interest rates at an extreme, will continue to provide an environment conducive to continued escalation in financial asset prices. That is the bet being placed by those who expect significantly more capital appreciation in financial assets from current price and valuation levels.
While there is a widespread belief that this is all going to end badly at some point in time, that point in time could well be extended further into the future by the Fed maintaining their status quo. That is the bullish argument for U.S. equities right now, and about the only rationale I can detect to be reasonably utilized to justify continued exposure to what is surely an overall high risk, low reward investing environment
___________________________________________________________
Market Update: It is really turning into a market where traders can go take a nap after the open and come back for the final 30-60 minutes of trading. So if you are currently trading for a living through the open hours it may be a great time to start a fitness program or do back testing or anything rather than watch computer screen for movement! I highlighted last week that even the pros are being hit by how much of the daily trading volume has been crammed into the final minutes of the day, so there is no need to sit there and watch the live charts all day because they are not going anywhere. Much of this is due to programed trading, lower expenses at the end of the day and perhaps the current market condition.
Today’s market action revealed very little about price action intention. Nice range that resulted in a mixed market with no traction.
SPX: Another roundtrip from support to resistance and back to no-man’s land. If weekly momentum has its way prices should continue to be weak for at least another week or so. Again if traders have the luxury of being able place orders off support and then sell at support or vice versa you can pick up 75 cents to a dollar on option trades with SPY.
NDX: Same story as the S&P but the NASDAQ 100 is bouncing off support at the 20 day EMA and not the 50 day EMA. If price will close below the 20 day or the 4484 level then the 50 day would be the downside target.
RUT: Prices action pushed up to the down trending channel line we identified a few days ago. The Russell finished up just a bit while the NDX and SPX were down for the day. While the strategy of trading the pullbacks and rebounds is fine, at some point they will stop working and the plunge will begin. I think the RUT is set up to plunge faster and deeper than the other indexes.
Trade Management: Stops and targets on INCY, FLT and ARRS remain the same as yesterday.
Specialty Trade: AMBA reports earnings after hours today and there was little reaction in either direction. I opened a speculative downside trade selling the weekly 83×84 call credit spread for a credit of 80 cents on five contracts. The risk on this trade was 20 cents times the number of shares we control which is 500 shares. I will place an order to buy the spread back between 20-30 cents. If price stays above 83 then I will buy the position back on Friday for $1.
Highlight Stocks: Other stocks on the radar: PAYC, NOAH, CYBR, JUNO, VDSI, HABT*, CMCM and THRM. Here’s a stock that may be a sleeper trying to put in a bottom: NKTR.
Early Warning Alerts: Waiting for secondary entry or new trigger.