Good Day Traders,
Overview & Highlights: This week’s edition of the Trader’s Report includes an excellent article by Mike Trager answering the big question on everybody’s mind. How High is High?
I hope all are learning from the bonus trainings that have come out lately to compliment the regular Wednesday night training sessions. I’m working to keep both the bonus trainings and live Facebook broadcast short (less than 15 minutes) and timely. We have also had an uptick in trading alerts now that training on the TSI Tick-up and Seasonality has been complete. The TSI Tick-up is a very powerful tool for defining objective entry criteria!
I hope all members have seen some of the live Facebook broadcast. If you want notification of when these live market updates take place, please follow Active Trend Trading at: https://www.facebook.com/ActiveTrendTrading/
Upcoming Webinars: At Active Trend Trading we offer three webinars per week to provide training plus trade and market updates. See the schedule below for the next webinars.
The How to Make Money Trading Stock Show—Free Webinar every Friday at 11:00 a.m. PDT. This weekly live and recorded webinar helped traders find great stocks and ETF’s to trade with excellent timing and helped them stay out of the market during times of weakness.
How to Make Money Trading Stocks on Friday, Feb 24th
Register now for the next live webinar at the link below:
Register Here: https://attendee.gotowebinar.com/register/3791291295737251075
Time 11:00 a.m. PDT
Next Training Webinar: Feb 22nd
For Premium Members, our Wednesday evening training is developing some fantastic traders
Topic: Stop Making Stupid Trades
** Friday’s “Final Hour”: Feb 24th **
Time 12:00 p.m. PDT
For Premium Members, provides trades and set ups during the final hour of weekly trading.
Managing Current Trades:
Strategy I Portfolio Building: Long IDCC at 92.30 on 1/25
Stop at 5% or close below 8 day EMA
Profit Target T1 = Sold 2/10 at 96.90; 4.98% or a Profit of $414
Profit Target T2 = Sold 2/22 at 100.95; 8.78% or Profit of $733.50
Long DUST at 25.63 on 2/10
Stop at 23.75
Profit Target T1 = Sold 2/21 at 28.15; 9.83% or Profit of 277.20
Profit Target T2 = 20%
Adjusted Trailing Stop to 27 and trigger 2/21 sold at 26.99; 5.31% or Profit of 149.60
Mike’s Macro Market Musings: How High is High?
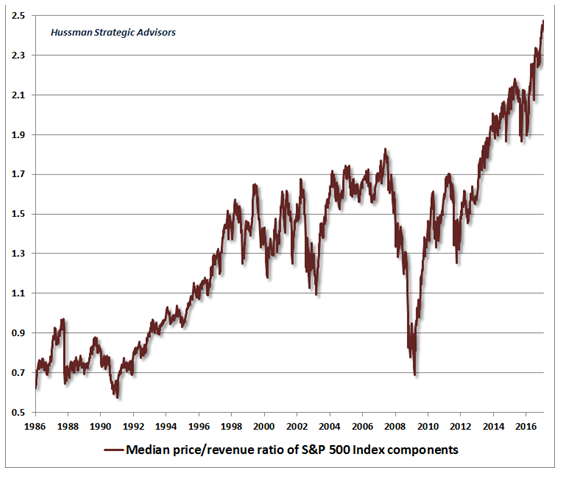
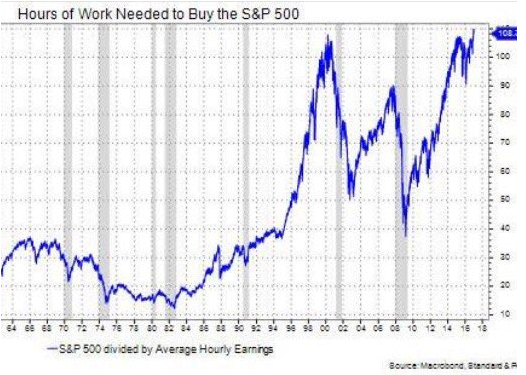
Before getting into the “meat” of this posting, take a moment for a brief and fun diversion to the following song culled from a cloudy memory of my 1960’s adolescence, the title and refrain of which seems appropriate to the following content: https://www.youtube.com/watch?v=cDjnB_61k58 I know that many of you reading these postings may well view me as some sort of permabear regarding the U.S. equity markets. While I might take exception to this opinion, I do have my reasons for being concerned about the longer-term future performance of the equity indexes we track as a gauge of our equity market, such as the S&P 500, reasons I have delineated in prior postings. And I am certainly not alone. The following charts are just more examples of the source of these concerns:
I think the charts speak for themselves without much explanation required. In summary, the first chart illustrates the current median price/revenue ratio of the S&P 500 index and the second chart shows how many hours of work (current average hourly earnings) are required to buy one share of the S&P 500.
However, despite the current extremes in market valuations, I will acknowledge that there is a bullish argument to be made for further advances in index prices and for even more extreme valuations going forward. In a nutshell, the gist of the bullish argument is that much of the world is currently experiencing a significant amount of turmoil causing a good bit of geopolitical uncertainty. Europe is falling apart and the EU seems to be on the cusp of disbanding, China is slowing down and capital is leaving the country, the Middle East is perpetually unstable, Iran, North Korea, and Russia are seemingly testing the boundaries of international peace agreements, Greece and Italy are essentially bankrupt, and Spanish central bankers are now literally on trial in their courts of law.
When allocating capital, imagine for a minute you’re managing a few billion dollars of institutional money and you have a mandate to stay relatively fully invested at all times. Now let me ask you where you’re going to allocate your capital looking out over the next couple of years? Despite our perception of domestic chaos and disapproval of our current president and his fledgling administration, the U.S. is looking relatively stable from a global perspective, the best looking horse in the glue factory, so to speak. So it’s easy to understand that investment capital will flow away from areas of turmoil and uncertainty and towards regions that might be considered safe havens, and a good portion of capital will flow into the equity markets of these “safe haven” regions since it seems to have nowhere better to go. To a large extent, this is already happening as foreign capital is being directed into the U.S. equity markets, helping to drive index prices to new all time highs seemingly by the day and week. For example, even with U.S. markets (and global markets in general) at long term or all time highs, the sovereign wealth fund of Norway, traditionally almost solely dependent on oil for its revenues, has just recently increased its investment portfolio allocation for stocks from 60% to 75%, and a good portion of that increased allotment of investment capital will find its way to U.S. equities. Note that this capital flowing into the US will have nothing to do with US corporate profits or revenues or valuations and none of this will really have anything to do with policies enacted by the Trump administration (though you can bet your bottom dollar Trump will be sure to take credit for it, misunderstanding what is actually taking place and why).
Is the US equity market overvalued? Yes! Can it become even more overvalued? Yes! Do I want to short this set up? Not really. While I and many others firmly believe this will all eventually end badly, the beginning of that end is probably not yet at hand, and it’s highly likely that we will only know with certainty when the “end” began at a point in time when we can benefit from 20/20 hindsight.
If you want to read more about this line of reasoning, here’s a link to get you started: https://capitalistexploits.at/2017/02/bucket-economics-global-macro/
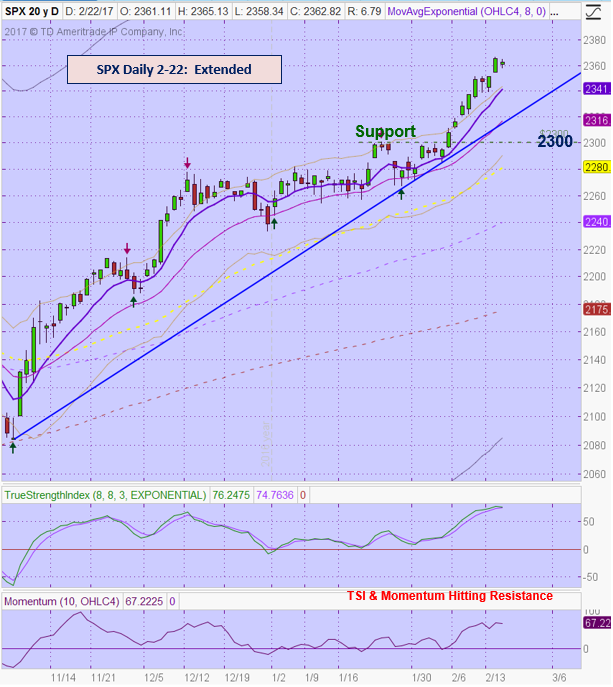
General Market Observation: At some point the Indexes will need a pause from the blistering pace of the current uptrend. Currently, clues for a reversal are increasing, but price action has not gotten the message. The daily charts for each of the three Tracking Indexes look show that TSI is rolling over and Momentum is waning. This does not mean the price action is ready for a retreat! The uptrend is intact and support trading pullbacks. The expected February weakness associated with the historical pattern for a post-election market has not materialized yet.
SPX showed a Bearish Harami on a daily chart yesterday. If this signal is voided by taking out the high of 2/21 then higher appears to be the path of least resistance. A pull back to the moving averages or even a healthier pullback would remove the overbought condition and perhaps provide a set up for more upside.
NDX has run over 10% since the end of December. Both TSI & Momentum are reaching level not seen for several years so it would seem a pullback is in order. Same trading idea applies of waiting for pullbacks until a full-fledged trend change takes place.
RUT showed a Dark Cloud reversal candle pattern on 2/22. This index is the weakest of the three. If there is a downside trade, this Index may be the best candidate.
The current optimism and positive expectation for corporate and personal tax cuts, less regulations and an improved business climate is a factor fueling the current rally. Any event that takes place that could derail these expectations could slow or halt the current rally. Historically in a post-election market a pullback from February through April would be expected. Clearly, this has been delayed for the Trump Presidency.
SPX: Downside Market Short the SPY, SPY Puts or SPXU.
Preferred Long ETF’s: SPY, UPRO and SPXL
NDX: Downside Market Short the QQQ, QQQ Puts or SQQQ.
Preferred Long ETF’s: QQQ and TQQQ
RUT: Downside Market Short the IWM, IWM Puts or TZA.
Preferred Long ETF’s: IWM and TNA
The How to Make Money Trading Stock Show—Free Webinar every Friday at 11:00 a.m. PDT. This weekly live and recorded webinar helped traders find great stocks and ETF’s to trade with excellent timing and helped them stay out of the market during times of weakness.
How to Make Money Trading Stocks on Friday, Feb 24th
Register now for the next live webinar at the link below:
Register Here: https://attendee.gotowebinar.com/register/3791291295737251075
Time 11:00 a.m. PDT
To get notifications of the newly recorded and posted How to Make Money Trading Stocks every week subscribe at the Market Tech Talk Channel: https://www.youtube.com/c/MarketTechTalk
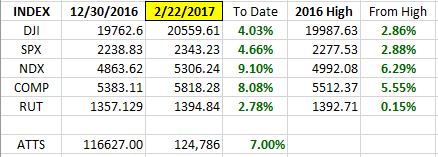
Index Returns 2017 YTD
ATTS Returns for 2017 YTD Closed Trades
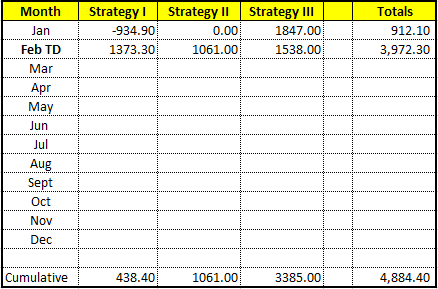
Percent invested initial $116.6K account: Strategies I & II invested at 18.60%; Strategy III invested at 26.6%.
Current Strategy Performance YTD (Closed Trades)
Strategy I: Up $438.40
Strategy II: Up $1061.00
Strategy III: Up $3385.00
Cumulative YTD: 4.19%
Active Trend Trading’s Yearly Objectives:
– Yearly Return of 40%
– 60% Winning Trades
– Early Warning Alert Target Yearly Return = 15% or better
For a complete view of specific trades closed visit the website at: https://activetrendtrading.com/current-positions/
Updated first full week of each month. The next update after first week in March.
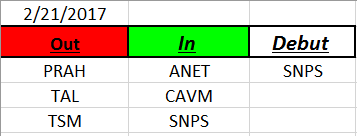
Outs & Ins: SNPS makes its debut on the IBD 50 mid-week. It’s extended and not in at a buy point.
The fundamentally strongest stocks sorted out to be: IDCC (Earnings 2/23), AMAT, ESNT and THO. THO is closest to a setup with earnings set for 3/6 AMC. ESNT has pulled back to the 50 day EMA so with a TSI Tick-up it may be a buy soon. NVDA is in a buy position after a TSI Tick-up on 2/21. If using the swing low at 104ish position size properly because a drop to this level will be about a 6% loss.
Share Your Success: Many of you have sent me notes regarding the success you are having with the Active Trend Trading System. Please send your stories to me at dww@activetrendtrading.com or leave a post on the website. Thanks.

