Good Day Traders,
Overview & Highlights: Check out Mike’s Macro Market Musings in this edition. He provides an in-depth discussion of divergences that we need to be aware of which could be predicting a market turn. Price action in the Indexes may be moving into a holding pattern until after the Fed announcement on December 14th. A case can be made that a Fed interest rate hike is already priced into the market, but we’ll standby and play small ball until Wednesday of next week.
Upcoming Webinars: At Active Trend Trading we offer two webinars per week to provide training plus trade and market updates. See the schedule below for the next webinars.
The How to Make Money Trading Stock Show—Free Webinar every Friday at 11:00 a.m. PDT. This weekly live and recorded webinar helped traders find great stocks and ETF’s to trade with excellent timing and helped them stay out of the market during times of weakness.
How to Make Money Trading Stocks on Friday, Dec 9th
Register now for the next live webinar at the link below:
Register Here: https://attendee.gotowebinar.com/register/3195696840396152833
Time 11:00 a.m. PDT
Next Training Webinar: Dec 7th
For Premium Members, our Wednesday evening training is developing some fantastic traders!
Topic: 5 Objective Profit Exits
Mike’s Macro Market Musings: Black Line’s Matter
Much, but not all, of the following is copied and pasted from another source. To read the full article, go to: http://www.zerohedge.com/news/2016-11-29/advance-decline-line-divergence-big-deal-spoiler-alert-yes .
Dennis and I have recently commented on the relative lack of breadth underlying the recent historical post-election rally in U.S. equity markets. Sharp rallies that seem to go straight up on the charts following relatively minor pullbacks without the support of either volume and/or market breadth seem to be a characteristic of the cyclical bull market which has prevailed since early 2009. We have also commented at length and on numerous occasions of the outsized influence on the price action of weighted indices of a relative handful of influential stocks.
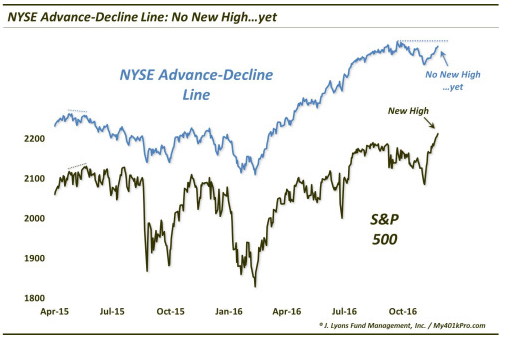
There is currently evidence of a mild divergence setting up between the price action of the S&P 500 index and the NYSE Advance/Decline line, as would be evidenced on the following chart if trendlines were drawn along the recent tops of both the index and the advance/decline line:
Why might this be noteworthy? Why am I even bothering to write about this? Because a non-confirmation by the A-D Line has historically been a significant warning for stocks – at times. Every important cyclical top in the S&P 500 in the last 50 years has been accompanied by a divergence in the A-D Line.
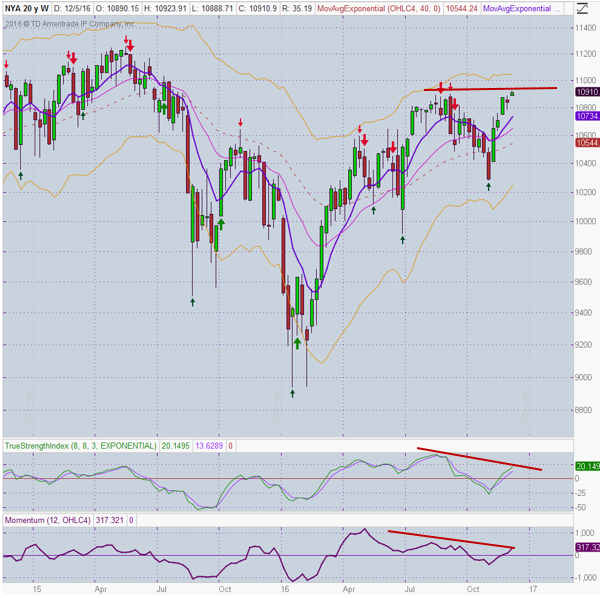
However, there are caveats associated with this potential set up (the word “potential” should be heavily emphasized here). Consider that not every divergence of this type leads to a significant cyclical market top. Divergences can persist – for a long time. Consider the 2000 top in the S&P 500. The A-D Line had actually peaked in 1998, 2 years before the Index topped. And, on the other side of the spectrum, sometimes we have to be a little patient in allowing the A-D Line to catch up to the S&P 500 at new highs. That is, sometimes, the large caps may lead a bounce and it may be that the broader market simply needs a day or two to catch up. Thus, we must be careful not to prematurely label the relative large cap strength a divergence. Additionally, this observation of the relationship of the S&P 500 to the advance/decline line does not hold if a similar comparative chart between the NYSE index (ticker symbol: NYA) and the advance/decline line were to be drawn – there is no divergence in that relationship since the NYSE index has not put in new highs recently, consistent with the lack of a new high in the advance/decline line. While we’re speaking of NYA and negative divergences, I’d recommend taking a look at a weekly chart of NYA and the marked negative divergences currently apparent in some of the more traditional oscillators such as slow stochastics and CCI and TSI when comparing current price action with highs noted in August and September of 2015.
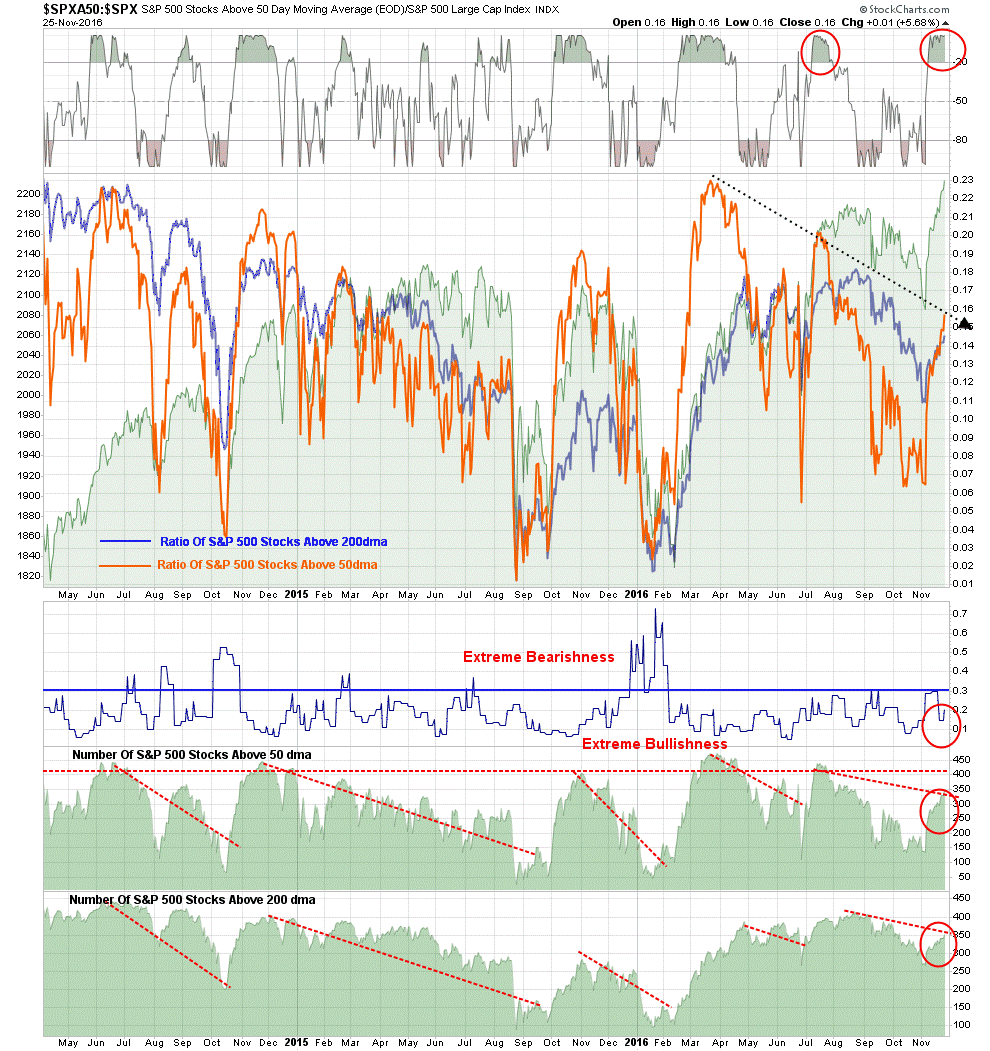
Also of note and potential significance indicating the relative lack of breadth in this most recent rally in the market indexes are the marked negative divergences between S&P 500 price action and the number of stocks trading above their 50 and 200 day moving averages, as follows:
So, are divergences in the NYSE Advance-Decline Line significant? Often, but not always. Certainly, something of which to be aware, though. Especially in conjunction with other signals noted in a recent article such as the Hindenburg omen and the so called Akron omen which historically have proven to be significant even if not 100% perfectly predictive. There are a few signals that put us on alert whenever they pop up. A divergence in the NYSE A-D Line is one of them, no matter the circumstances.
Fans of a cable TV show named “Suits” will understand the following reference. To paraphrase a famous line of dialogue from that show, the question now becomes – what will Janet do?
General Market Observation: Last week the Trump Rally slowed down as profit taking and European financial issues appeared. Both the RUT and SPX went on a rocket ride after the election with the Nasdaq 100 lagging both the other 2 Tracking Indexes. Today’s market action was a mixed bag. On all three Indexes a resistance ceiling is in place. The RUT made the strongest move and will hit resistance at the 1347 level. Both the SPX and NDX were up for the day but without the same vigor as the Russell.
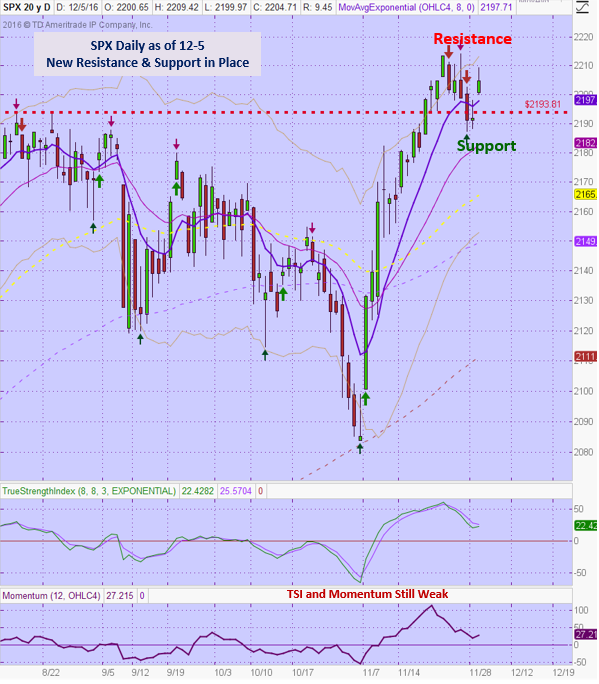
The chart of the SPX shows a good move up but retreated late in the day. The long upper wick shows that the sellers showed up at a resistance zone just short of 2210. Look for sideways move between 2190 and 2213 until the Fed reports. The NDX is still lagging the other indexes. Price while up closed below the 8/20/50 day moving averages. This cluster defines current resistance. Because of the weakness on NDX, SQQQ continues to look like a viable trade buying off support.
SPX: Downside Market Short the SPY, SPY Puts or SPXU.
Preferred Long ETF’s: SPY, UPRO and SPXL
NDX: Downside Market Short the QQQ, QQQ Puts or SQQQ.
Preferred Long ETF’s: QQQ and TQQQ
RUT: Downside Market Short the IWM, IWM Puts or TZA.
Preferred Long ETF’s: IWM and TNA
The How to Make Money Trading Stock Show—Free Webinar every Friday at 11:00 a.m. PDT. This weekly live and recorded webinar helped traders find great stocks and ETF’s to trade with excellent timing and helped them stay out of the market during times of weakness.
How to Make Money Trading Stocks on Friday, Dec 9th
Register now for the next live webinar at the link below:
Register Here: https://attendee.gotowebinar.com/register/3195696840396152833
Time 11:00 a.m. PDT
To get notifications of the newly recorded and posted How to Make Money Trading Stocks every week subscribe at the Market Tech Talk Channel: https://www.youtube.com/c/MarketTechTalk
– The Active Trend Trader Referral Affiliate Program is ready. For more information or to become an Affiliate please register here: https://activetrendtrading.com/affiliates-sign-up-and-login/
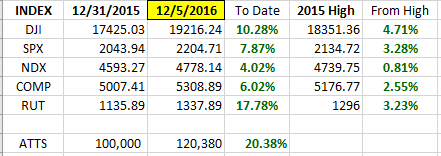
Index Returns YTD 2016
ATTS Returns for 2016 through Dec 5, 2016
Percent invested initial $100K account: Strategies I & II invested at 3.00%; Strategy III invested at 20%.
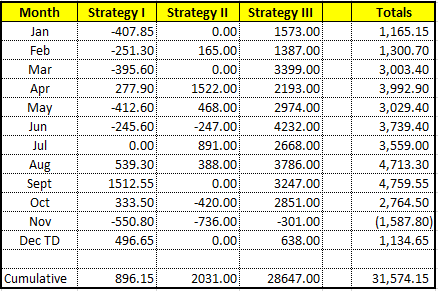
Current Strategy Performance YTD (Closed Trades)
Strategy I: Up $896.15 or +1.28%
Strategy II: Up $2,031.00 or +20.3%
Strategy III: Up $28,647.00
Cumulative YTD: 31.5%
Active Trend Trading’s Yearly Objectives:
– Yearly Return of 40%
– 60% Winning Trades
– Early Warning Alert Target Yearly Return = 15% or better
For a complete view of specific trades closed visit the website at: https://activetrendtrading.com/current-positions/
Updated first full week of each month. The next update after first week in January.
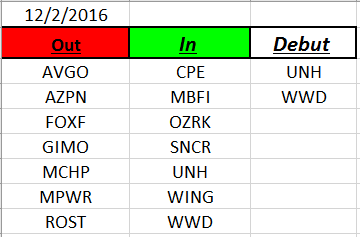
Outs & Ins: Both UNH and WWD made a debut on the IBD 50 this weekend. Both stocks are well extended above their moving averages after solid moves up recently. Neither are close to a valid entry point.
The stocks with the strongest fundamentals this week are: AEIS, AMAT, CPE, NVDA, WOR, ESNT & EXP.
Share Your Success: Many of you have sent me notes regarding the success you are having with the Active Trend Trading System. Please send your stories to me at dww@activetrendtrading.com or leave a post on the website. Thanks.

