Good Day Traders,
Overview & Highlights: Price action on the Indexes is getting sloppy with above average daily swings. Prices bounced back to resistance today. Is there enough price momentum to re-establish an uptrend?
Thanks for the great comments on the new format for the Monday and Friday free webinars. Short and to the point, actionable intel.
Upcoming Webinars: At Active Trend Trading we offer four webinars per week to provide training plus trade and market updates. See the schedule below for the next webinars.
After Market Monday’s—Free Fast Paced Webinar every Monday after the Market closes at 1:15 p.m. PDT. Find you invitation at: https://www.facebook.com/ActiveTrendTrading/
How to Make Money Trading Stock Webinar—Free Webinar every Friday at 11:00 a.m. PDT. This weekly live and recorded webinar helped traders find great stocks and ETF’s to trade with excellent timing and helped them stay out of the market during times of weakness.
How to Make Money Trading Stocks on Friday, March 31st
Register now for the next live webinar at the link below:
Register Here: https://attendee.gotowebinar.com/register/4478489362405518337
Time 11:00 a.m. PDT
Next Training Webinar: March 29th
For Premium Members, our Wednesday evening training is developing some fantastic traders
Topic: ATTS Rules—By the Numbers
** Friday’s “Final Hour”: March 31st **
Time 12:00 p.m. PDT
For Premium Members, provides trades and set ups during the final hour of weekly trading.
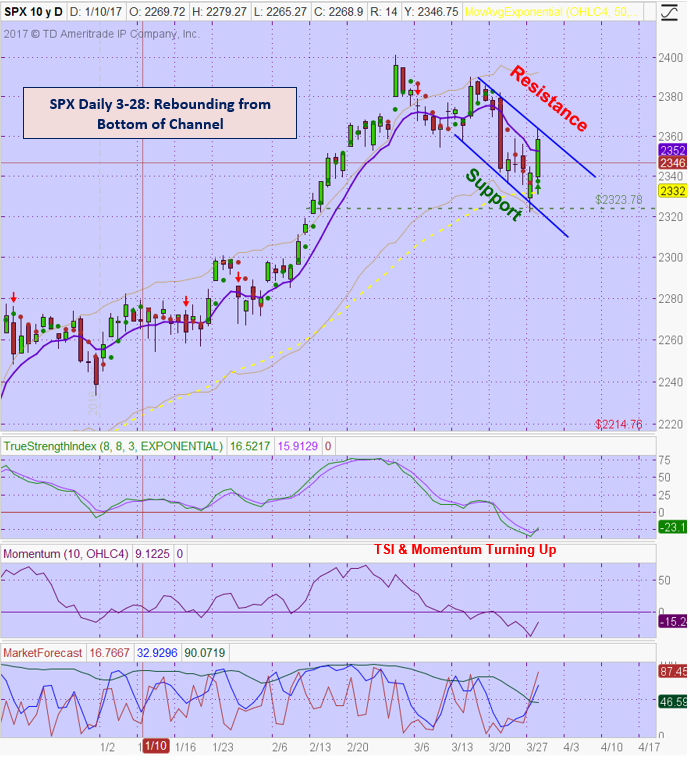
General Market Observation: The Tracking Indexes show a resilient market with many mixed signals. Markets with mixed signals can be challenging to navigate and lead to whipsaw. Starting with the SPX. Price action is in a short-term downtrend, but rebounded strongly yesterday from the bottom of the channel which coincided with the 50 day EMA. Additionally, prices bounced from the 2323 level which was the downside target when price broke from a symmetric triangle on 3/21. The daily chart of SPX is telling us that there may be more upside with both the TSI and Momentum turning up. As highlighted yesterday in the “After Market Monday” Webinar, the daily and weekly chart indicators are out of synch. For the short-term downtrend to be reversed price must move and close above the upper channel line. If this happens then a new higher swing high is needed to set price action back into an uptrend. Yesterday’s bounce and today’s follow through was a good start, but until the resistance is busted it is just price action with an established short-term downtrend.
NDX is in a sideways trend or consolidation pattern. Because it continues to be the strongest of the three Tracking Indexes QQQ or TQQQ may provide a trade if prices breakout or retest intraday.
The Russell is working with in a short-term downtrend channel. Note that its price action is weaker than the other two Indexes. Price is stuck below the 20 and 50 day EMAs. Yesterday prices bounced from the 100 day Moving Average. On market weakness look to IWM or TZA for potential trades. If the current rebound continues the RUT will become interesting between the 1375 and 1380 levels. Depending on time required, these levels may coincide with the upper channel line.
SPX: Downside Market Short the SPY, SPY Puts or SPXU.
Preferred Long ETF’s: SPY, UPRO and SPXL
NDX: Downside Market Short the QQQ, QQQ Puts or SQQQ.
Preferred Long ETF’s: QQQ and TQQQ
RUT: Downside Market Short the IWM, IWM Puts or TZA.
Preferred Long ETF’s: IWM and TNA
The How to Make Money Trading Stock Show—Free Webinar every Friday at 11:00 a.m. PDT. Updated format—short, sweet and to the point! Market, Stocks & ETFs.
How to Make Money Trading Stocks on Friday, March 31st
Register now for the next live webinar at the link below:
Register Here: https://attendee.gotowebinar.com/register/4478489362405518337
Time 11:00 a.m. PDT
To get notifications of the newly recorded and posted How to Make Money Trading Stocks every week subscribe at the Market Tech Talk Channel: https://www.youtube.com/c/MarketTechTalk
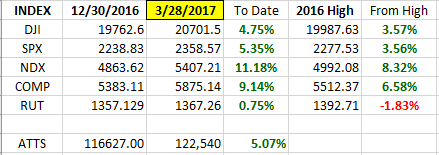
Index Returns 2017 YTD
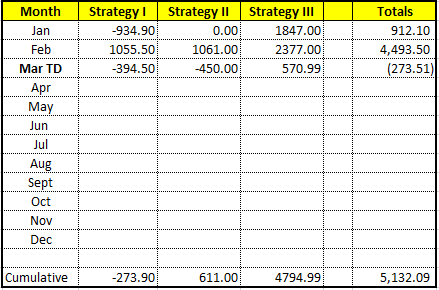
ATTS Returns for 2017 YTD Closed Trades
Percent invested initial $116.6K account: Strategies I & II invested at 1%; Strategy III invested at 26.6%.
Current Strategy Performance YTD (Closed Trades)
Strategy I: Down -273.90
Strategy II: Up $611.00
Strategy III: Up $4794.99
Cumulative YTD: 4.40%
Active Trend Trading’s Yearly Objectives:
- Yearly Return of 40%
- 60% Winning Trades
- Early Warning Alert Target Yearly Return = 15% or better
For a complete view of specific trades closed visit the website at: https://activetrendtrading.com/current-positions/
Updated first full week of each month. The next update after first week in April.
Outs & Ins: No stocks added to the IBD 50 mid-week. The Fundamental Sort of the mid-week list resulted in following top stocks: AEIS, NTES, ANET, CGNX and NTRI.
Other IBD 50 stocks of interesting include ESNT, NVDA and WB.
Share Your Success: Many of you have sent me notes regarding the success you are having with the Active Trend Trading System. Please send your stories to me at dww@activetrendtrading.com or leave a post on the website. Thanks.


