
December 11, 2017
Good Day Traders,
Great post tonight with the year end Mike’s Macro Musings! His topic to close off the year? “They Don’t Ring the Bell at the Top…Or do They?” For Trend followers this is an excellent update!
Remember to register for the After Market Monday and Making Money Trading Stocks and ETFs each week. In these webinars I will provide 10-12 stock set ups per year. All Levels of ATTS members will receive these trade email alerts. Keep an eye out for a new composite watch list that will provided a weekly composite of strong growth stocks & IPO potential which are providing immediate profit opportunities! New Composite List Provided Below!
Here’s a list of the BONUS Trades since October.
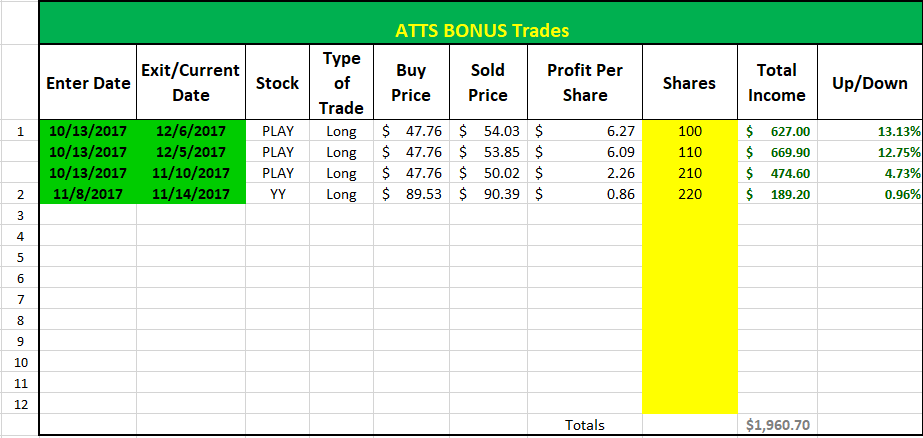 Providing these BONUS Trades for all Active Trend Trader Members regardless of membership level is my way of saying thank you for being a member. Of course Premium Members receive the Text Alerts and Email Alerts for all 3 of the ATTS Strategies. Email me if you want to upgrade at a discount: dww@activetrendtrading.com
Register here to not miss the BONUS Trades or the ATTS Webinar Invitation list: https://forms.aweber.com/form/33/1084761733.htm
Mike’s Macro Market Musings: They Don’t Ring A Bell At The Top, Or Do They? And, A Trend Following Update
There is an old cliche (seems like most cliches are old, doesn’t it?) associated with the financial markets that says “they don’t ring a bell at the top”. As is the case with most cliches with which I am familiar, there is a strong element of truth to this. Trying to call a market top (or bottom) is usually nothing more than an exercise in futility and potentially dangerous to your financial well being. However, there have historically been some indications that a market top or bottom is relatively near as evidenced by, just to provide one example, financial and mainstream media declarations that either “equities are dead” near equity market bottoms or “nothing can stop the bull market from continuing” near market tops after advances of 300%, 400% (or more) in popular equity indexes. A classic historical example of this is the 1979 cover of Business Week magazine declaring the death of equities:
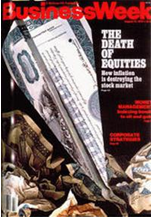 At the time the article was written the Dow Jones Industrial Average was at 800. However, 1979 roughly marked a turning point (emphasis on “roughly”, the market bottom was not simultaneous with the publication date of that issue of the magazine), and stocks went on to enjoy a bull market for the better part of two decades, with the Dow eventually reaching a level just shy of 12,000 at the peak of the dot com mania in 2000
In my humble opinion, something similar has just happened in the past several weeks. My disclaimer first – trying to call a market top the past few years has proven to be an impossible task, and magazine covers are not the only types of contrarian indicators to reference. So what’s going on, Mike? Hey, thanks for asking.
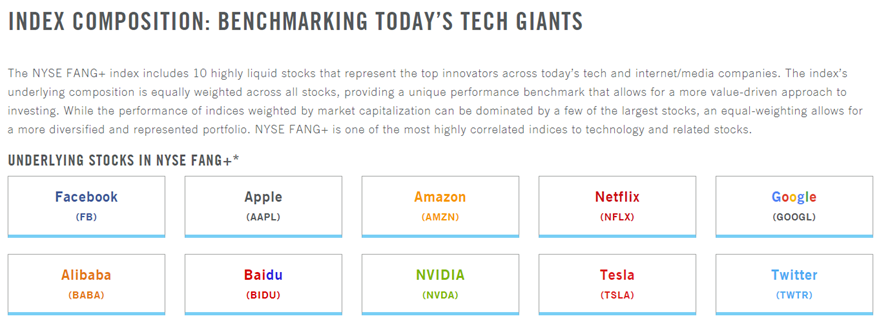
As market observers and participants we should all know very well by now of the undue influence and focus the past few years on the relative handful of stocks referred to by the acronym FANG – Facebook, Amazon, Netflix, and Google – market darling big cap stocks that, as a small group, have accounted for a significant percentage of the gains witnessed in the widely followed equity indexes with which we are familiar. Or, we could use the acronym FANG+ to indicate that a couple of other stocks such as Apple should be included in that discussion but I think you get the idea.
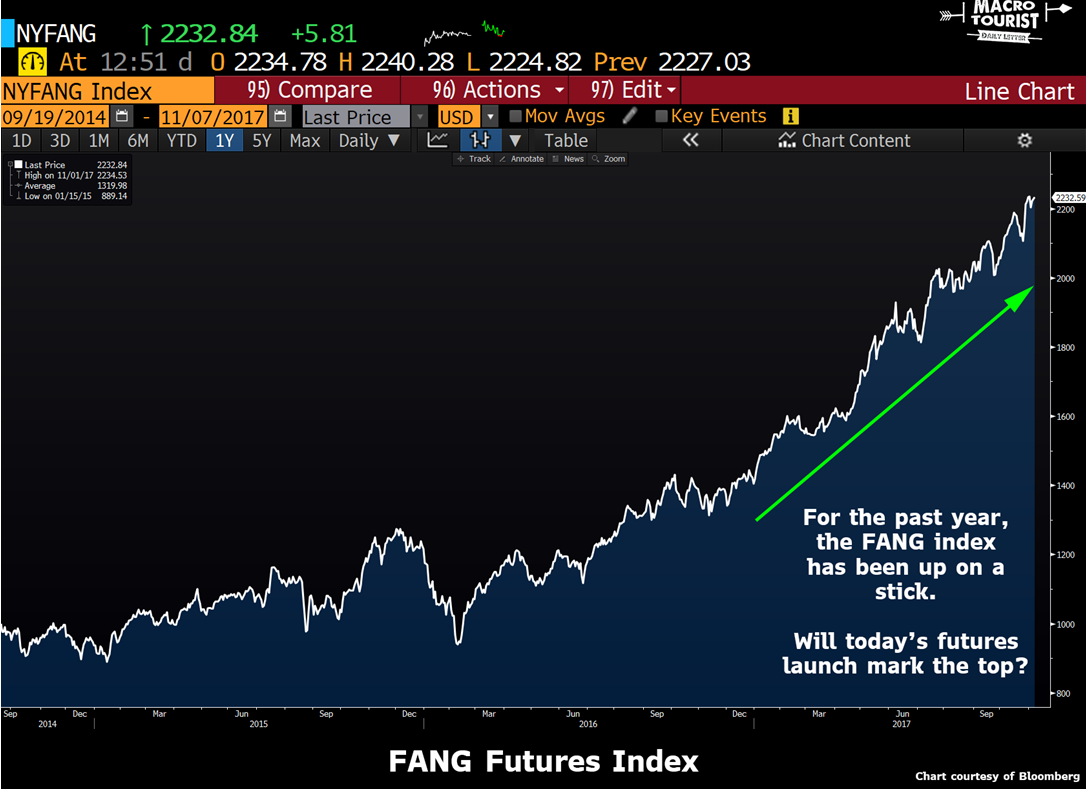
After years of nearly unworldly price advances in these stocks and the indexes which include them, the financial industry has just very recently finally decided that maybe it would be a good idea to build financial products around them that could be sold to the investing public. There is now in existence a FANG index, which can be charted (see below) and traded via a FANG futures contract which is based on the FANG index and/or a FANG etf (ticker symbol FNG). The etf just became available for trading/investing in July, 2017, and the futures contract just became available in November, 2017.
 In the interest of being thorough, the FANG index is actually composed of 10 popular momentum tech stocks, not just the four you would expect, whose stock price advances the past few years have been just as, or even more, remarkable as the four “biggies”:
 And the FANG etf actually contains 28 stocks, all of which are high momentum tech stocks. But, I think you hopefully get the point.
Yes, I know it’s not a magazine cover, but just saying…. They don’t ring a bell at the top, or do they?
On a completely different note, I have highlighted in past articles the trend following strategy for longer term investment accounts of either monitoring or actually trading/investing the market indexes, notably the S&P 500, by utilizing a 10 month simple moving average on a monthly chart, and the remarkable performance of this strategy over a period of more than 60 years going back to around 1950. The strategy allows an investor to take advantage of much of the significant uptrends in overall bull markets while avoiding much of the carnage wreaked by the occasional bear markets which inevitably follow. The specifics of the strategy are quite simple and can be referenced in those same past articles along with an illustration and table of hypothetical results going back to 1950. It is absolutely guaranteed that one will never catch a market bottom or top with this methodology, nor does one need to do so. No need to monitor magazine covers, ringing bells, or investment fads – you can disregard and forget about all of that. The following illustration should provide a pretty good visual image of this methodology and how to employ it if one is of a mind to do so:
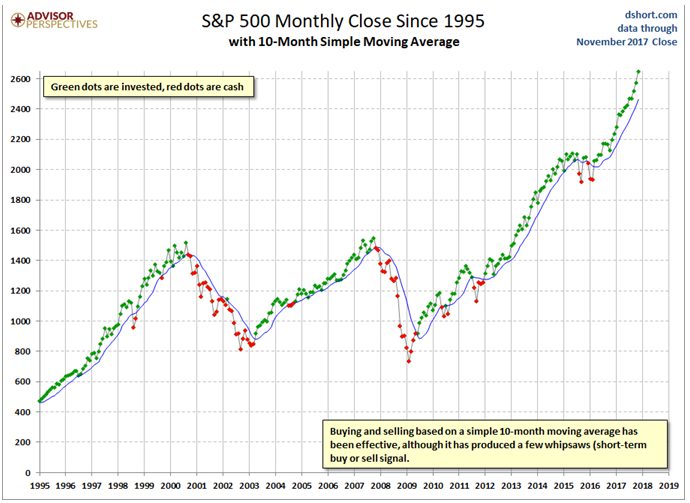 The most recent signal or trigger produced by this strategy occurred at the end of March, 2016, when the monthly candlestick for the S&P closed above the 10 month sma with a reading of 2060. S&P price has remained above the 10 month sma for the 20+ months since then and currently reads 2639 as of the moment I am writing this on 12/7/17, an advance of roughly 28% for the non-leveraged index. Utilizing a leveraged index etf such as UPRO, the 3x etf for the S&P 500, to implement and trade this strategy, one would have bought UPRO on the open the first trading day of April, 2016, at 62.03, and stayed in the position since then since there has not been a close below the 10 month sma which would trigger an exit. UPRO currently trades at 134.27 as of this moment and has been as high as 138, an advance of over 120% from the roughly 62 entry price. You might note that the performance of the 3x etf has been greater than a 3x multiple of the performance of the non-leveraged index itself. And all that has been required is doing nothing more than monitoring the price of SPX at the close of the last trading day of each month in relation to the 10 month sma and taking no action beyond the indicated entry trigger on the first trading day of April, 2016.
While it would be naive to assume that all of the signals this methodology produces yield similar results (they don’t always), enough of them do that the resultant expectancy or profit factor for this system is astounding, as delineated in prior articles. Just for some perspective, the two triggers prior to this most recent one yielded results, utilizing UPRO as the trading vehicle, of approximately +235% and -6%. Just 3 trades compounded over a period of 6 years (and counting) since the beginning of 2012, 2 of them successful (the jury is still out on the third and current trade), would have turned a hypothetical $10,000 account into an account with a current balance approaching $69,000, with an absolute minimum of effort and activity. Simpler can truly be better, and sitting on your hands can often be more productive than not doing so.
With that, I begin a bit of a sabbatical while going through the process of moving to a new home, a process I truly do not relish. Allow me to wish all of you and your families and friends a serene and happy holiday season with a minimal weight gain and a fruitful and prosperous 2018. And please try to avoid the temptation of getting involved with trading Bitcoin!
Be well!
Running List, Strongest Fundamental stocks on the IBD 50 and the NEW Composite List of Stocks showing up on multiple IBD Watch List on December 8th & 9th.
Running List: 197 growth stocks have appeared on the IBD 50 in 2017. No Stocks were added to this week’s list. Here is the total Running List: Running List 12-8
When the new IBD 50 list comes out twice per week I conduct a fundamental sort which results in the top fundamental IBD 50 stocks being identified. The top fundamental stocks for this week are: OLED, ANET, ALGN & HTHT. This sort is provided at: IBD 50 12-8 Sorted
A new addition to the weekly watch lists for Active Trend Traders is a Composite List of IPOs and Growth Stocks appearing on multiple IBD watchlist each weekend. When a stock appears on multiple of the premium List it can potentially be an indication of excellent strength. The stocks on the weekly Composite List may not be at a sound trigger point but may be worth watching for future entries. I will do an analysis of the list looking for price near potential triggers. Stocks near potential triggers will be highlighted. The top stocks 5 stocks appearing on more than one IBD watch list last week: ESNT, GRUB, AVY, CBOE, & FB. GRUB just broke out and shows support at $69.63 The Composite List for this week: Composite List 12-9