
September 3, 2017
Good Day Traders,
Through the end of August this year had certainly been explosive! Active Trend Trading has been simplified down to just a few stocks and ETFs to feed into one of our 3 Strategies. Combined performance is pushing in on 30% with the powerful end of year surge still in windscreen! My objective through the last 4 months of 2017 is to catch the seasonal swings on both the Tracking Indexes plus the commodities/industries we are tracking.
To meet this objective and set up the 2018 trading campaign, I’m doing more research which will refine seasonality trades. These refinements will improve entry timing and exits plus make teaching the Active Trend Trading System easier. My overarching goal continues to be making the Active Trend Trading System, Clearer & Simpler to use so each trader can Multiply their results!
Today’s Update include Mike’s Latest Market Musings and links to the most recent Running List Watchlist. Remember the Premium Membership will be offered at a discount through September 4th so lock in your savings by Monday! https://activetrendtrading.com/combo-membership-intro/
Mike’s Macro Market Musings: What You Know That The “Experts” Don’t
I have long ago given up on tuning in to CNBC, Cramer, business news TV channels and websites, etc. The talking heads and so called “experts” have proven to me that, for the most part, their opinions and advice are often useless and non-actionable and sometimes downright tainted, although there is sometimes some decent background information to be gleaned. Studies have been done on the results and effectiveness of Cramer’s stock picks and recommendations and the results have been found to be very mediocre at best. Some of the cliches or so called “truisms” issued by these market pundits can lead to personal financial disaster if acted upon blindly.
The opinions that matter are those that are expressed by the actions taken by the people and institutions that have the ability to make things happen. In other words, pay attention to what they do, not what they say (actually, this has been a primary guiding principle in my personal life for a very long time, more so now at my current age than ever before). This is information that can be readily gleaned from technical charts that show the actions being taken by those that can make things happen.
Since you’re reading this you are a subscriber to the ATTS service, an indication that you are learning to read charts and utilize trading and investing methodologies based on those charts and other technical indicators. You are to be congratulated for doing so! As a result, you usually know more in real time than the so called “experts”. In fact, I would propose that you are more of an expert than the “experts” and will become even more so as your journey and education and knowledge progresses. You are the “guru” in your circle of influence, don’t ever allow yourself to think otherwise.
Just for fun, let’s look at some past and current “expert” opinions, and the charts associated with them, and see just how some of those recommendations followed through:
In 1999, building up to the peak of the dot com bubble, there was a lot of talk in the financial media that the markets were very overbought and couldn’t go higher. What did the chart of the Nasdaq Composite have to say about that?
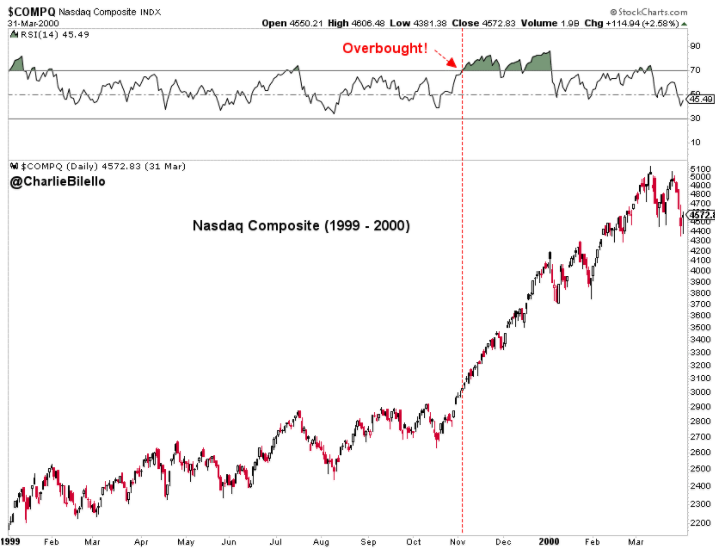
A couple of technical tips here: 1) There are momentum trading systems out there that advocate going long when the RSI or similar oscillators enters into an “overbought” zone. 2) For an uptrending entity support can often be found when the 14 period RSI pulls back to a reading of around 30-40 – wait for price action and reversal candlesticks to confirm, though.
Or, “Something is ‘oversold’ or ‘at support’ and has to go back up.”
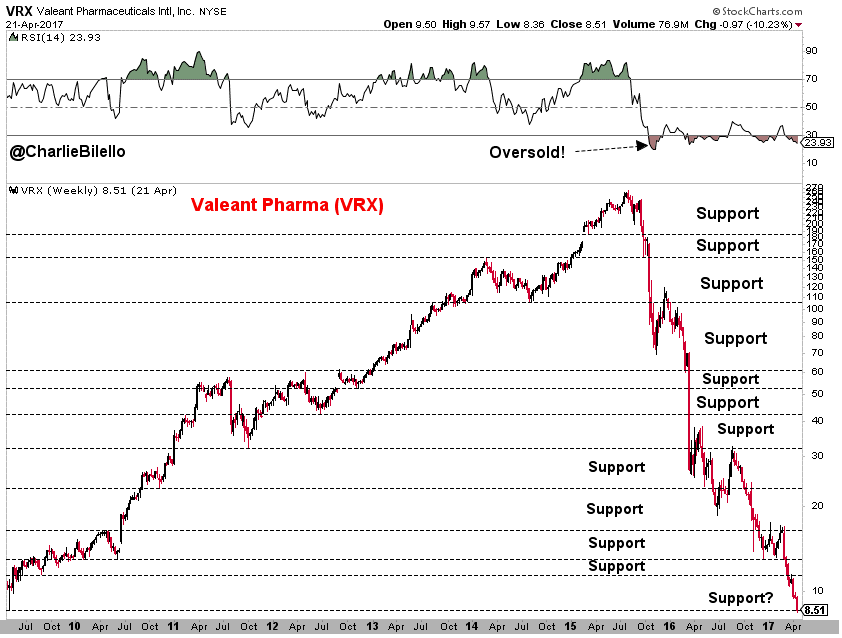 Note: this stock was a hedge fund darling just a relatively short time ago. Many hedge funds kept adding to their positions as the stock kept falling and ultimately lost literally hundreds of millions, perhaps even billions, of dollars on it, not to mention the damage to their assets under management (AUM) and their reputations and investor bases.
“It can’t go to 0.” Really?
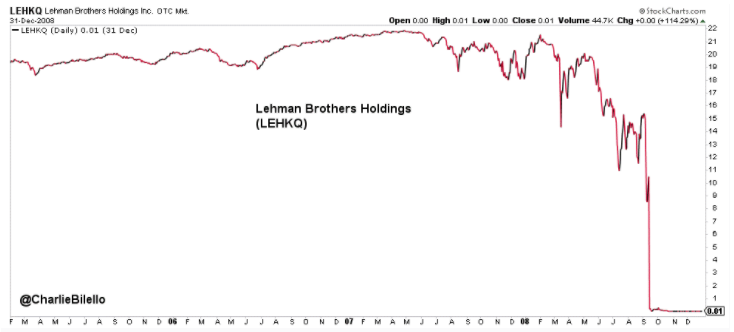
VRX didn’t exactly go to zero but got close enough for government work, I believe. Lehman Brothers, at one time a venerable Wall Street investment bank, actually made it all the way.
Or, you remember someone once told you, “Value is a good reason to short something.” OK…..
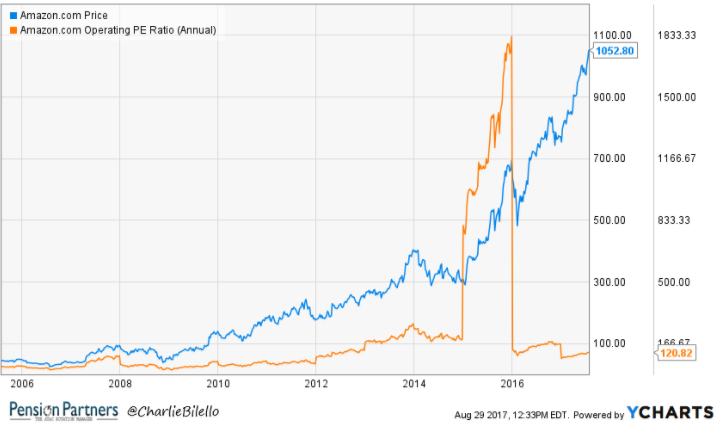
Someone tells you, “Following pundits/gurus is an effective investment strategy.” I think we should now know better….
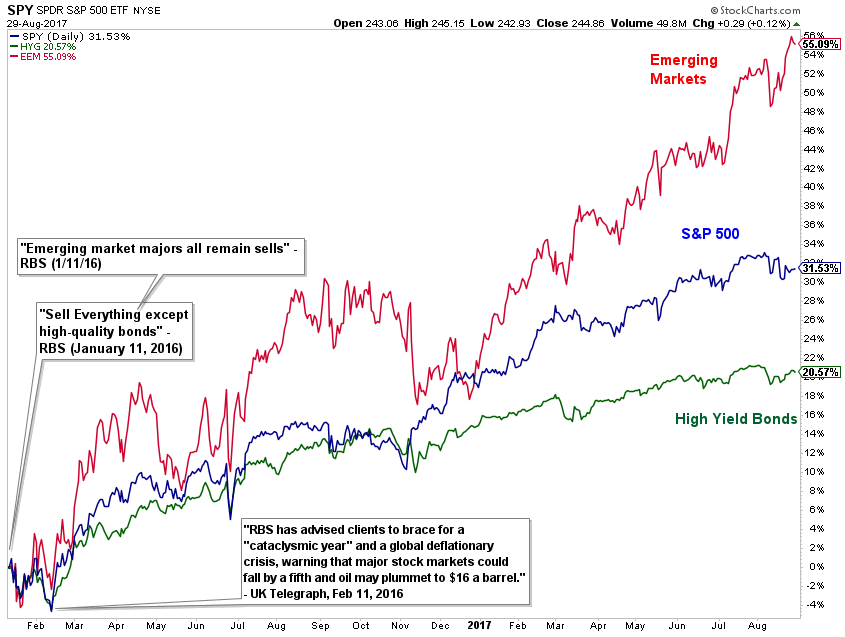
In fact, early February, 2016, our EWA system, based on recognizing very oversold conditions by utilizing a number of different technical indicators, triggered and turned out to be a phenomenally successful buying opportunity in the U.S. equity indexes both short and longer term
I think you get the picture, so to speak. The charts will show what the influential institutions are doing; learn to tune out what they say.
Running List & Strongest Fundamental stocks on the IBD 50 for September 1st
Look for more earnings excitement next week as other leading growth stock report. Will the market continue to demonstrate a mixed behavior? we shall see!
Running List: 175 growth stocks have appeared on the IBD 50 in 2017. ALRM & LGIH were added to the list this week. ALRM is extended but LGIH just rebounded from the 50 day EMA with powerful volume. Here is the total Running List, download the full list here: Running List 9-1

Additionally, when the new IBD 50 list comes out twice per week I conduct a fundamental sort which results in the top fundamental IBD 50 stocks being identified. The top fundamental stocks for this week are: BABA, ANET. This sort is provided at: IBD 50 9-1 Sorted
Lastly, to sign up Free Webinars for this week at the GO HERE links below!
After Market Monday Webinar: GO HERE Tuesday this Week!!!
Making Money Trading Stocks & ETFs Webinar: GO HERE
HOME