
Good Day Traders,
Overview & Highlights: I’m coming back to the mainland for a couple of months on Thursday. There will be no Friday webinar because I’ll be travelling to Bakersfield, CA for my sister-in-law’s wedding. The August BAMM Meeting will be in onsite at the San Jose Masonic. The rest of August I’ll be writing from the road as my wife and I do a tour of a bunch of states we’ve never visited. Updates and training webinars will go be provided throughout this month long trip.
Don’t miss Wednesday’s training session. We will be presenting some excellent new discoveries about which candlestick pattern have the highest probability of success. Plus, other new observations that will aid all Active Trend Traders in becoming better traders.
Webinars: At Active Trend Trading we offer two webinars per week to provide training plus trade and market updates. See the schedule below for the next webinars.
How to Make Money Trading Stocks on Friday, July 29th—Friday, week after next.
Register Here: https://attendee.gotowebinar.com/register/1191963339500657924
11:00 a.m. PDT
Next Training Webinar: July 20th
For Premium Members our Wednesday evening training is developing some fantastic traders!
New Candlestick Discoveries—The Probability of Success
General Market Observation: Each of the Tracking Indexes pushed higher at the beginning of last week but slowed down a bit on Thursday and Friday. This could be showing that the current up thrust is out of gas and either a pullback or sideways move is in order. The S&P was clearly the strongest of the three Indexes pushing to a new all-time high. Both the NDX and RUT showed indecision into the end of the week. With the SPX breakout it is in a new uptrend. Additionally, there is no overhead supply/resistance to plan for. In circumstances like this I use the Fibonacci Extensions to see where price action is likely to at least slow. Price action has slowed at the 138.2% extension of the move from 6/23 through 6/27. If price holds and bounces from this level, then I’ll look for resistance at the 161.8% (2191 Level) extension. Another clue that the current rally may be slowing is the Time Extension that compares the current thrust with the thrust from 5/19 to the high on 6/8. The time required for the May thrust has been equaled on Friday 7/15. Can prices continue to push higher? Without a doubt! What I will do is go with the current trend but define where I will consider long entries. This will be on solid and uniform pullback to the 8/20 or even 50 day moving averages. If there is no pullback wait for the moving averages to catch up. Currently price is extended from these moving averages and outside the Keltner Channel. So for the SPX, I wait.
The NDX put in two interesting candlestick patterns last week. On Wednesday the NDX finished with a Bearish Engulfing pattern. This pattern was voided on Thursday by a move higher. Friday’s candle engulfed Thursday’s candle forming for two Bearish Engulfing patterns for the week. While both patterns stand alone, when two pattern appear in short order their effect must be considered. The Bearish Engulfing pattern has about a 78-79% probability of leading to a trend reversal that will last at least 5-10 days. If this pattern confirms it will initially be treated as a pullback for a bullish entry. If the Indexes weaken significantly look for either the NDX or RUT to lead to the downside.
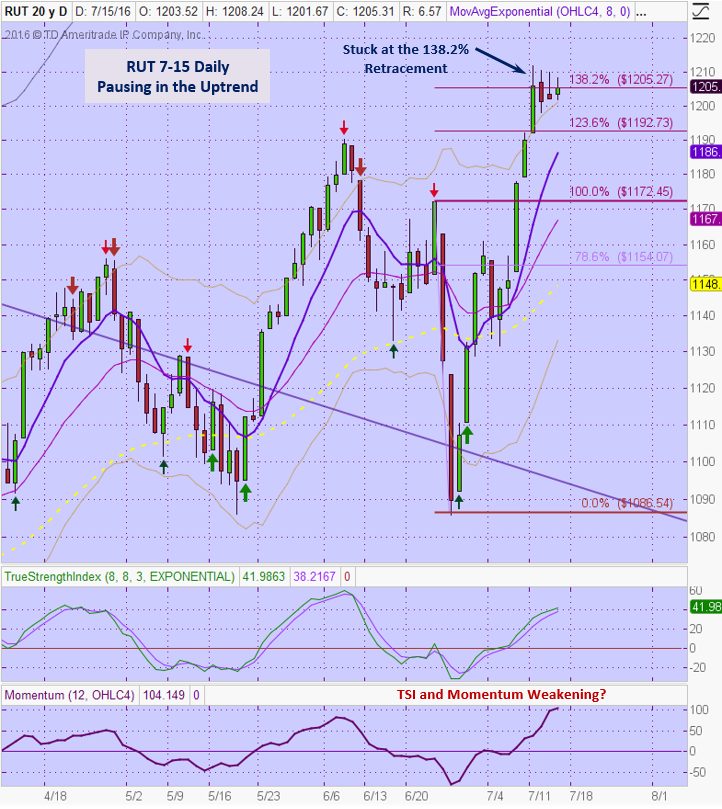
Tonight I’m showing the daily Russell chart. Price action last week penetrated the 138.2% extension and then went sideways with doji’s or small body candles. Price has reached an extension objective and is resting for the next move either up or down. Like the other Indexes I want to see a pullback towards the means for a potential bullish entry.
Tempering my upside scenario is another pattern that has shown up the last 5 years. From 2011 through 2015 prices action weakened mid-July between July 19th and July 23rd. The weakness varied between tradable pullback to a more severe correction. At this point we have no idea whether this will materialize in 2016 but this may be a consideration in sizing an upside trade. The weakness in the past 5 years tended to last into latter August, September and in one case November. With this being an election year a big sell-off is probably not in the cards, but the market will do what the market wants to do.
SPX: Downside Market Short the SPY, SPY Puts or SPXU.
Preferred Long ETF’s: SPY, UPRO and SPXL
NDX: Downside Market Short the QQQ, QQQ Puts or SQQQ.
Preferred Long ETF’s: QQQ and TQQQ
RUT: Downside Market Short the IWM, IWM Puts or TZA.
Preferred Long ETF’s: IWM and TNA
The How to Make Money Trading Stock Show—Note time change. This change will allow a full hour after the webinar to adjust trades. Free Webinar every Friday at 11:00 a.m. PDT. I’m looking for the best time to offer this webinar. I want to try closer to the close on Friday to see how that works out for potential trades going into the close. This weekly live and recorded webinar helped traders find great stocks and ETF’s to trade with excellent timing and helped them stay out of the market during times of weakness. How to Make Money Trading Stocks on Friday,
July 29th—Friday, week after next.
Register Here: https://attendee.gotowebinar.com/register/1191963339500657924
11:00 a.m. PDT
To get notifications of the newly recorded and posted How to Make Money Trading Stocks every week subscribe at the Market Tech Talk Channel: https://www.youtube.com/c/MarketTechTalk
– The Active Trend Trader Referral Affiliate Program is ready. For more information or to become an Affiliate please register here: https://activetrendtrading.com/affiliates-sign-up-and-login/
Index Returns YTD 2016
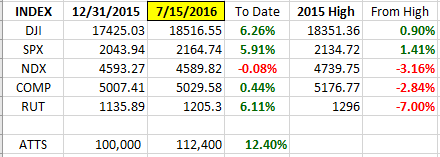
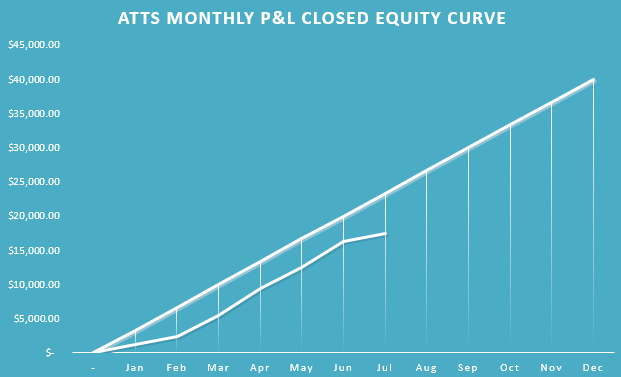
ATTS Returns for 2016 through July 15, 2016

Percent invested initial $100K account: Strategies I & II invested at 7.7%; Strategy III invested at 25.98%.
Current Strategy Performance YTD (Closed Trades)
Strategy I: Down -1435.05 or -2.05%
Strategy II: Up $2391.00 or +23.91%
Strategy III: Up $16540 or +61.03%
Cumulative YTD: 17.49%
Active Trend Trading’s Yearly Objectives:
– Yearly Return of 40%
– 60% Winning Trades
– Early Warning Alert Target Yearly Return = 15% or better
For a complete view of specific trades closed visit the website at: https://activetrendtrading.com/current-positions/
Updated first full week of each month. The next update August.
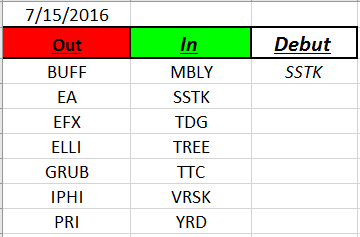
Outs & Ins: SSTK makes its debut on the IBD 50 this weekend. SSTK is in the process of pulling back and has earnings on 8/4 BMO. In the beginning of 2014 SSTK was at 100 and is early in a rebound from $25. It appears that the pullback will go on for bit longer until price action retraces to the 8/20 or 50 day moving averages. The Stocks patterns are ok but not great.
For those who are unfamiliar with the IBD 50 or the Running List the following is applicable to the two list. The IBD 50 is a computer generated list of growth stocks that meet the IBD fundamental criteria which is sorted twice weekly with the stocks scoring highest placed on the list. The IBD 50 fundamental criteria is very stringent and tend to look here for potential trades because if a stock passes the criteria it has good fundamentals. The Running List is a yearly collection of stocks that have appeared on the IBD 50. Currently 205 stocks have been listed in 2016.
Many of the IBD 50 stocks moved with the Indexes higher but have now slowed their climb and are showing small body “doji” candlesticks which is a mark of either resting or indecision. Additionally, quarterly earnings are in full-swing. Some members with potential pre-earnings swings include: COR, GIMO, WBMD and FB.
Share Your Success: Many of you have sent me notes regarding the success you are having with the Active Trend Trading System. Please send your stories to me at mailto:dww@activetrendtrading.comor leave a post on the website. Thanks.