
Good Day Traders,
Overview & Highlights: In tonight’s edition, Mike looks at the benefits of long term trend following on the DOW and S&P. Impressive!
I will provide another “Go-No Go” indicator on this week’s mid-week training session. This one will be even stronger that the one presented last week. If you are a Premium Member you do not want to miss this week’s training. If you are not a Premium now, it’s a great time to sign up because membership dues go up for new members on the 1st of April.
We broadcast the first “After Market Monday” webinar and received many positive emails. This will be followed with a shortened “How to Make Money Trading Stocks” on Friday. Because your time is important, I want to pack a quicker paced and shorter webinar in to approximately 10-15 minutes. It will include brief market update and a highlight of at least one trading opportunity. The first webinar would be on Monday’s shortly after the market closes to help prep for the week. The second webinar will be on Friday with a quick rehash of how the weekly plan turned out. If you have any comments or suggestions, please email me at: dww@activetrendtrading.com
Upcoming Webinars: At Active Trend Trading we offer three webinars per week to provide training plus trade and market updates. See the schedule below for the next webinars.
The How to Make Money Trading Stock Show—Free Webinar every Friday at 11:00 a.m. PDT. Updated format—short, sweet and to the point! Market, Stocks & ETFs.
How to Make Money Trading Stocks on Friday, March 21
Register now for the next live webinar at the link below:
Register Here: https://attendee.gotowebinar.com/register/4195221082087176194
Time 11:00 a.m. PDT
Next Training Webinar: March 22nd
For Premium Members, our Wednesday evening training is developing some fantastic traders
Topic: Two “Go-No Go” Indicators—Part 2
** Friday’s “Final Hour”: March 24th **
Time 12:00 p.m. PDT
For Premium Members, provides trades and set ups during the final hour of weekly trading
Mike’s Macro Market Musings: Trend Following – A Simple Method Updated
I grew up in coastal Southern California and while I never really got very involved with surfing, I had enough exposure to it to have experienced the true exhilaration of catching a good wave and being able to ride it a while until it was spent. I was also able to feel the frustration of trying to catch a wave and missing it, or starting out on one that really went nowhere and didn’t yield much of a ride at all. Similar experiences can be had when investing and trading in the financial markets utilizing true trend following methodologies. True trend following systems and methodologies can yield impressive results when markets are trending and your entry and exit triggers have allowed you to go for a long profitable ride. They can also result in periods of frustration when markets aren’t trending and your triggers produce prolonged periods of whipsaw action with many small losses and gains that add up to about nothing.
As a retired endodontist, one of my favorite (true) stories about trend following involves a dentist who started trading commodities in 1979 with a $200,000 account. I have no idea what his system has been (successful trend following investors and traders are understandably reluctant to share this with anyone), but what I do know is that over approximately a 25-year time frame he turned that $200,000 into $17 million by catching relatively few big moves and compounding his gains. I also know that he went through long periods of time when he made no money at all, but he persisted and eventually would catch a monster trend that would more than make up for those prolonged periods of whipsaw losses. He continued to practice dentistry and earn an income while doing this so he was not dependent on trading profits for his livelihood and was thus able to ride out the periods when there wasn’t much trading profit to be had.
Such is the nature of true trend following. Anyone who is interested in employing trend following strategies must be aware of and accepting of the following associated trend following tenets:
1.) You will never get in at the bottom and get out at the top of any move, don’t even try. Trends need to make themselves evident before there is an entry trigger, and they need to prove that they are spent before an exit trigger
2.) You are likely to have more losing trades than winners, perhaps many more. A successful system will keep the losers relatively small while allowing the winners to run
3.) You must take every signal that your system produces, no matter how you feel about it or how many whipsaw losses may have been realized preceding it. Feelings and opinions are not allowed, the system must be mechanical and methodically applied. You can never know at the time an entry trigger presents itself when you’re about to catch a nice long wave, but you have to be on it to be able to go for the ride (excuse the mixed metaphor).
One example of a trend following methodology is that endorsed by Dennis which dictates an entry when price action closes above an 8 period ema and an exit when price subsequently closes below the 8 period ema, thereby utilizing the moving average both as a trigger and trailing stop loss. This can be employed in any time frame. It works great when it works, and it doesn’t work every time. For longer term investment and retirement accounts, a similar method can be applied to monthly charts of the equity indexes. The following illustrations will provide some examples of this. The method is simple and effective and only involves a close above or below a 10-month simple moving average of the Dow and/or the S&P 500 (the 10 month sma is roughly equivalent to the 200 day sma on a daily chart), and is a long only system (that is, trades are only entered on the long side and sell triggers dictate exiting the long trades but not initiating trades to the downside by shorting) due to the known and previously discussed long term upside bias of the U.S. equity markets.
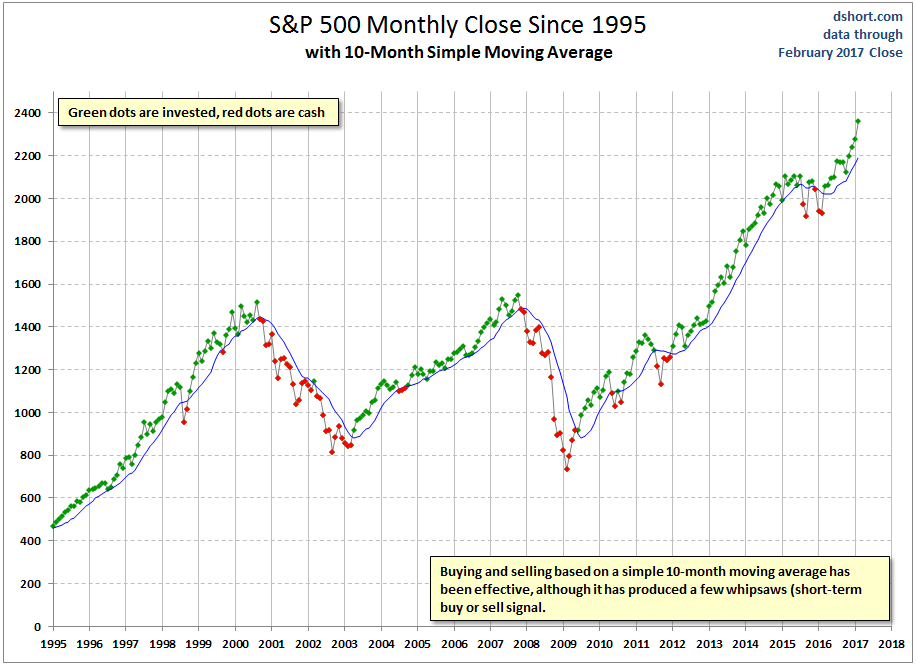
Even a casual glance of the above chart shows how effective this can be. It has allowed one to benefit from very long term uptrends that can last for years while minimizing exposure to much of the downside during the dot com bust of 2000 – 2003 and the housing and equity bust of 2007 – 2009. Just for fun, let’s dive a bit deeper and take a look at some of the numbers using the S&P 500 index itself non-leveraged, as follows:
Entry date Entry price Exit date Exit price % gain (loss)
1/3/1995 459 9/1/1998 958 109%
11/2/1998 1099 10/1/1999 1283 17%
11/1/1999 1363 10/2/2000 1437 5%
4/1/2002 1147 5/1/2002 1077 (6%)
5/1/2003 917 8/2/2004 1102 20%
11/1/2004 1130 1/2/2008 1468 30%
7/1/2009 921 6/1/2010 1087 18%
8/2/2010 1108 9/1/2010 1050 (5%)
10/1/2010 1144 9/1/2011 1219 7%
2/1/2012 1312 9/1/2015 1970 50%
11/2/2015 2081 1/4/2016 2038 (2%)
4/1/2016 2057 current 2382 16%
Overall, over an approximately 22 year period, this system yielded 12 trades with 9 winning trades and 3 losers, a 75% win rate with winning trades averaging a gain of 30% and losing trades averaging a loss of 4%. Keep in mind that this is the non-leveraged result of the index itself and I have done a bit of rounding to keep the arithmetic simple. 3 out of 4 trades are winners and the average winning trade gains approximately 7 times (!) what the average losing trades loses, a phenomenal expectation or profit factor. Does this seem like a potentially rewarding methodology for trading longer term accounts without requiring much activity or attention? I would think so.
Again, just for fun, let’s take a look back at the years of the Great Depression in the U.S. and the great stock market crash of 1929 and see how this methodology might have worked out:
A look back at the 10- and 12-month moving averages in the Dow during the Crash of 1929 and Great Depression shows the effectiveness of these strategies during those dangerous times.
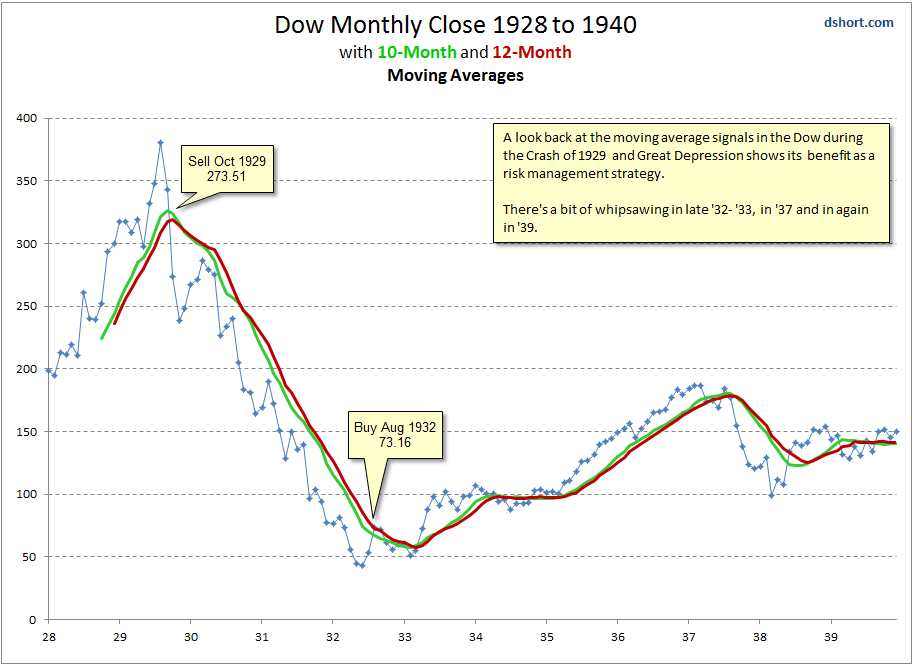
I’m not going to run the numbers on this, but it looks like it would have worked out pretty well for anyone who might have been able to know and apply this information at that time, most especially by saving one from the carnage of the market crash in 1929 by exiting the market at the end of October, 1929, just as the crash was gathering momentum, and getting back in at a much lower price in late 1932 after all of the damage had been done but not until the market had rebounded nearly 50% off the lows of early 1932.
The above is just an example of a simple but apparently very effective trend following strategy that exhibits all of the benefits and caveats that go along with any trend following system. Something to think about, and certainly not a recommendation of anything. One should carefully back test any kind of potential trend following system before going live with it. And, if employing shorter time frames than monthly charts, it might be realistic to expect more whipsawing and perhaps less robust overall results, even if still positive.
General Market Observation: Finally, capitulation to the downside! Today the 3 Tracking Indexes did a faceplant, falling hard! In the last Trader’s Report, I said we would learn a lot about the strength of the current market based on the reaction from the bounce which started on 3/14.
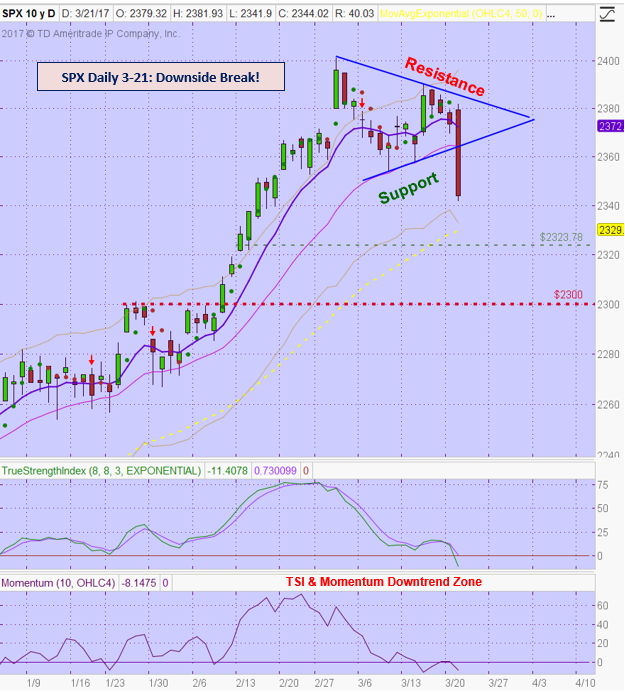
The SPX executed a classic reversal at a lower swing high as it tried to retest the highs. This is a negative for this index at least in the short term. What can we glean from the price action over the past four days? First, support formed by the symmetric triangle was ruptured today. The expected measured move from this breakdown is at the 2323.78 level. Note that this level is close to the 50 day EMA and a 61.8 Fibonacci Retracement (Low 1/23-High 3/1). Secondly, the range of today’s price action is larger than any since fourth quarter 2016. Large price action like this are often mark the point of significant trend changes. Lastly, levels of past support reverse polarity and become levels of future resistance. For the SPX this would be around 2360. Check out the weekly chart to see what happened the last time the TSI crossed to the downside. The downward bias on the SPX lasted for eleven weeks before finding support at the 40 week Moving Average. A similar move now would take prices to about the 2300 level around the week of May 30th. If price action accelerates to the downside it would be indicative of a more severe correction.
NDX provide a large Bearish Engulfing candle today, wiping out the gains from the past 15 days. Prices sliced through the 8 and 20 day EMAs. There is support at the 5300 level. If this level breaks look for a retest at the 50 day EMA.
The Russell fell harder than the other two Indexes. The fall stopped just short of support at the 1342 level. Those who are following the “Go-No Go” triggers covered in last week’s training, note how Monday’s price action close with a red candle below a Green Ball at a lower swing high. Great follow through today with prices slicing through the 8, 20 and 50 day EMAs. Use the intraday chart to trigger a short trade on IWM or long trade on TZA if the RUT retest in the middle third of today’s candle.
SPX: Downside Market Short the SPY, SPY Puts or SPXU.
Preferred Long ETF’s: SPY, UPRO and SPXL
NDX: Downside Market Short the QQQ, QQQ Puts or SQQQ.
Preferred Long ETF’s: QQQ and TQQQ
RUT: Downside Market Short the IWM, IWM Puts or TZA.
Preferred Long ETF’s: IWM and TNA
The How to Make Money Trading Stock Show—Free Webinar every Friday at 11:00 a.m. PDT. Updated format—short, sweet and to the point! Market, Stocks & ETFs.
How to Make Money Trading Stocks on Friday, March 21
Register now for the next live webinar at the link below:
Register Here: https://attendee.gotowebinar.com/register/4195221082087176194
Time 11:00 a.m. PDT
To get notifications of the newly recorded and posted How to Make Money Trading Stocks every week subscribe at the Market Tech Talk Channel: https://www.youtube.com/c/MarketTechTalk
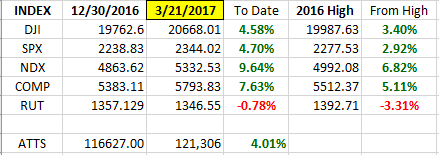
Index Returns 2017 YTD
ATTS Returns for 2017 YTD Closed Trades
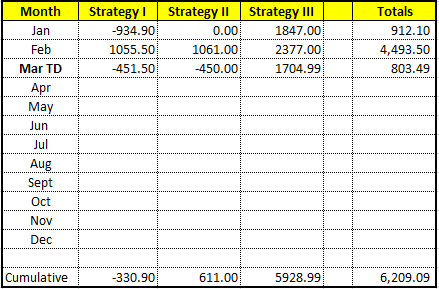
Percent invested initial $116.6K account: Strategies I & II invested at 17%; Strategy III invested at 26.6%.
Current Strategy Performance YTD (Closed Trades)
Strategy I: Down -330.90
Strategy II: Up $611.00
Strategy III: Up $5928.99
Cumulative YTD: 5.32%
Active Trend Trading’s Yearly Objectives:
– Yearly Return of 40%
– 60% Winning Trades
– Early Warning Alert Target Yearly Return = 15% or better
For a complete view of specific trades closed visit the website at: https://activetrendtrading.com/current-positions/
Updated first full week of each month. The next update after first week in April.
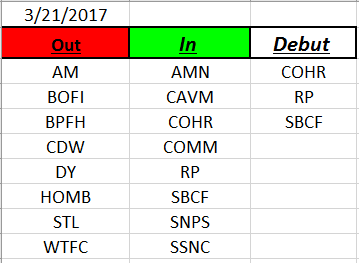
Outs & Ins: COHR, RP and SBCF debut on the IBD 50 mid-week. COHR held up well during today’s sell off while the other two entrants traded with the Indexes.
The top stocks on today’s fundamental sort were: AMT, ESNT and NTRI. NVDA held up during today’s selloff. Watch the list for stocks holding above the 50 day EMA. If the market does a quick correction these should come out of the gate first.
Share Your Success: Many of you have sent me notes regarding the success you are having with the Active Trend Trading System. Please send your stories to me at dww@activetrendtrading.com or leave a post on the website. Thanks.