Good Day Traders,
Put out a lot of content on the website and YouTube channel this weekend hope everyone enjoys these additions. We are still on grandson watch, thanks for asking!
Thanks for all the great comments about the ATTS service and the “How to Make Money Trading Stocks” webinar that blast out every Friday at 10 a.m. Pacific. You can either join live or catch the replay on YouTube.
Here’s the link for next Friday’s Show: https://attendee.gotowebinar.com/register/3046133559484368385
For Premium Members our Wednesday evening training is developing some fantastic traders!
Mid-Week Market Sanity Check Topic: Successful Process Trading—Thinking and Acting like a Great Trader
_____________________________________________________
This week we have the second installment of Mike’s Macro Market Musings. Just to be clear neither Mike nor I are “perma-bears” or purveyors of doom. We are simply reporting what the charts are flashing. There will be a market debacle but the big question is when?
Mike’s Macro Market Musings: Bubble, Bubble, Toil and TROUBLE – Part 2
Building on the context and foundation established in the last column, what might we be able to reasonably predict about the intermediate term prospects for U.S. equity markets? Where are we currently in U.S. equity markets, and what might that tell us about where we might be headed? As always, a picture can be worth a thousand words (more or less); physical space limitations will not allow for a thousand words, so we need to employ visual images at the expense of text. If you’re a visual learner like me, this will likely not be terribly objectionable.

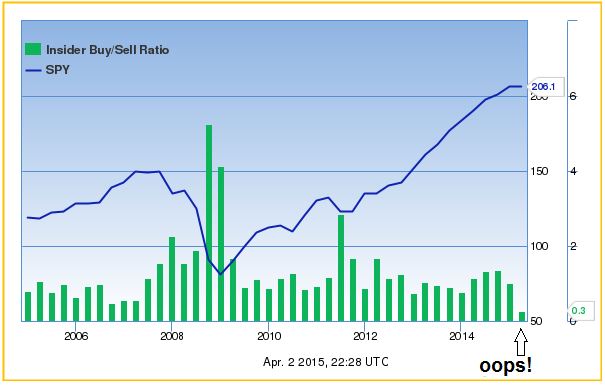
The above chart shows the ratio of corporate insider buying/selling relative to price levels of SPY, the index etf for the S&P 500, as of April 2, 2015. Note the strong levels of insider buying relative to selling as the market was selling off and bottoming in late 2008 and early 2009 and the relatively lower levels of buying as the market was topping in late 2007. Where are we now? Insider buying relative to selling is apparently weaker now than it was even in late 2007. Corporate insiders are smart even if not perfect market timers. Currently, they have become net sellers of stock – they are buying far less than they are selling. They were correct in 2007, 2008, 2009. I believe this speaks for itself.

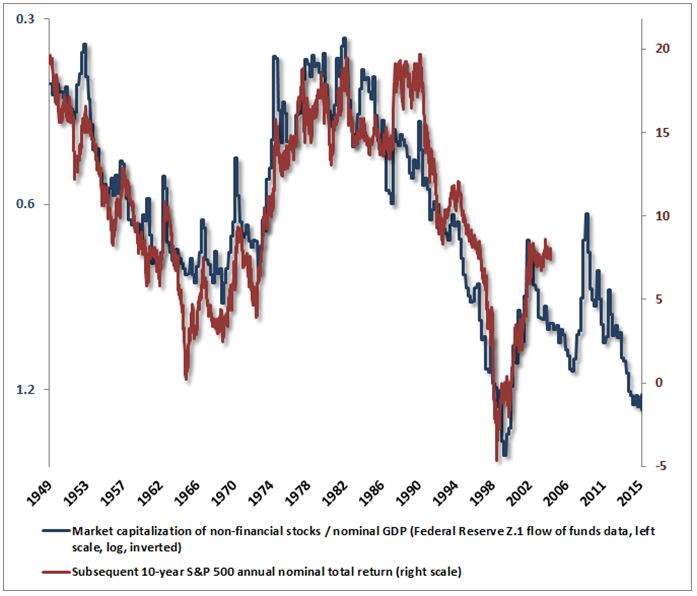
Again, I think the above speaks for itself. The ratio of overall stock market capitalization to GDP, aka Warren Buffett’s favorite indicator of stock market valuation, has never been higher than it is today with the exception of the peak of the internet bubble in 2000 and possibly the peak of the 1929 markets before the Crash of October, 1929, preceding the Great Depression of the 1930’s. Don’t think for a second that corporate insiders are unaware of this.
 What is this telling us? Historically, that when the ratio of market cap/GDP approaches or exceeds the area of 1.0, or even 1.2, the subsequent 10 year annual gains of the nominal S&P 500 index are limited to low single digits or even negative returns. If this history repeats itself, or at least rhymes with itself, going forward from current valuations and the current value of this particular metric, we can reasonably expect little to any overall nominal price appreciation in the S&P 500 index over the next 10 years from its’ current price level of approximately 2100.
 Again, I think this one speaks for itself. Note the similarity in the vertical acceleration on the right edge of this chart with the vertical acceleration in late 1999 and early 2000 on the weekly Nasdaq chart shown in the prior column. We know how these parabolic vertical advances have concluded in the past. Will it be different this time? Wikipedia defines a “stock market bubble” as follows: “A stock market bubble is a type of economic bubble taking place in stock markets when market participants drive stock prices above their value in relation to some system of stock valuation”. Given the above definition, there can’t be any question that global stock markets, including the U.S., are currently in a bubble that will break at some point in time. The current extremes in the Chinese markets may quite possibly lead to a bursting of that particular bubble in a relatively short time frame. My opinion is that will be a catalyst, amongst others, that drives significant corrections in other global markets. Price action on weekly and monthly index charts will speak to timing of these inevitable pullbacks. It’s very possible that this process has already begun. Market tops are usually only discerned on price charts in hindsight, but behavioral characteristics associated with market tops can be observed in real time, and it’s my belief that such behavior is currently on display. Bubble, bubble, toil and TROUBLE, indeed.
_______________________________________________
General Market Observation: After reading Mike’s article I know one thing for sure, this market is not one I would bet the farm on to the long side right now. This has been our theme for the past couple of months. The Indexes have clearly moved into a range bound stage. This is not to say that there are not trading opportunities for “fast and furious” trades that last a few days on the index ETF’s or even longer term opportunities with individual stocks. The trick is choosing wisely!
A question that came up this weekend was about the inverse Index ETF’s. Our research indicates that the inverse ETF’s are a less attractive trading vehicle because of the effects of contango and backwardation. The essence of these effects is that due to the contracts that must be bought and renewed on a regular basis to provide an inverse ETF they tend to lose value over time. Check out the websites for these entities and you will find that they are prone to reverse splits due to these effects. So if you do trade the inverse manage your holding period to just a few week and no more than 90 days! I find it best to trade direction puts on either the non-leveraged and leveraged bullish ETF’s.
SPX: Healthiest of the tracking Indexes. Friday’s move while on lower volume did approach the upper side of the resistance zone that has now been in place since late February. With price action approaching 2120 I’ll be looking for signs of weakness for potential downside trades on the SPY ETF.
Preferred ETF’s: SPY and SPXL
NDX: I’m not going to be fooled by Friday’s Gap up on bad news! We are still in a phase of Good News Inversion—the markets reacting positively to bad news. At this point the current move up on the NASDAQ 100 looks more like a Sucker’s or short lived relief rally!
Preferred ETF’s: QQQ and TQQQ
RUT: Weakest of the three tracking Indexes. The distractors are the down sloping 50 day EMA and weak weekly charts. Additionally the weekly charts are divergent with the daily charts and provide conflicting clues. When this is the case go with the longer term charts in developing a posture. With this said it doesn’t mean that the current bounce will not continue for a bit but overhead resistance between 1240 and 1248 will present a good test. This test may lead to a downside opportunity in either IWM or TNA.
The question each of must answer since we just opened a long position in TNA, will we be able to grasp taking a bearish position while holding a bullish position?
Preferred ETF’s: IWM and TNA
_____________________________________________
The Early Warning Alert Service has hit all three major market trading point this year. See this brief update video for more details: https://youtu.be/PRLmPQLHjiI
If simplifying your life by trading along with us using the index ETF is of interest you can get the full background video at: https://activetrendtrading.com/etf-early-warning-alerts-video/
The How to Make Money Trading Stock Show—Free Webinar every Friday at 10 a.m. PDT. This weekly live and recorded webinar helped traders find great stocks and ETF’s to trade with excellent timing and helped them stay out of the market during times of weakness.
The “How to Make Money Trading Stocks” Show is back this Friday, May 15th
Ensure you get a seat by registering now at:
https://attendee.gotowebinar.com/register/3046133559484368385
To get notifications of the newly recorded and posted How to Make Money Trading Stocks every week subscribe at the Market Tech Talk Channel: https://www.youtube.com/channel/UCLK-GdCSCGTo5IN2hvuDP0w
The Active Trend Trader Affiliate Program is ready. For more information or to become an Affiliate please register here: https://activetrendtrading.com/affiliates-sign-up-and-login/
______________________________________________________________
ATTS Returns for 2015 through May 8, 2015
Margin Account: 20% Invested
Margin Account = +2.0% (Open and Closed Positions)
Early Warning Alerts = +4.70%
Active Trend Trading’s Yearly Objectives:
– Yearly Return of 40%
– 60% Winning Trades
For a complete view of specific trades closed visit the website at: https://activetrendtrading.com/current-positions/
Updated at the beginning of each month.
___________________________________________________________
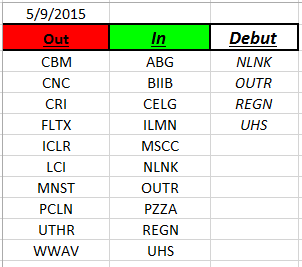
Outs & Ins: Over the past month the IBD 50 has introduced 25 more stocks. This is a healthy swap out of none performers but can also be indicative of market conditions bringing in laggards which tends to happen when markets start topping. NLNK, OUTR, REGN and an old time member UHS made the 2015 debut this weekend. Keep an eye on NLNK because it is in a trade range that covers about 29% from low to high! OUTR is also one with some potential with Friday’s big accumulation day.
The Running List has now climbed to a total of 135 stocks that have appeared on the IBD 50 this year. A review of the current IBD 50 list shows that there are a few leaders but a larger number of laggards. The advice is “choose wisely” this is a stock pickers market!
Only 5 stocks on the current list have not reported earnings and 4 of these will report over the next 2 weeks. These include AVGO, ULTA, ACT and NOAH. ACT reports 5/11 before the market opens so could provide some fireworks in the morning.
Comments and opinions written below this line of text may be provocative and only obliquely related to trading. Some may find these “Off the Wall” comments challenging to their outlook on life. I will not post any comments made on subject matter below this line, so if you disagree blast away.
OFF THE WALL
Off the Wall: I was reading this weekend about various civilizations that became vile and corrupt. Eventually the weight of the government largess and the number of citizens feeding from the public trough led to greater and greater corruption and dependency. At some point these civilizations imploded or fell from their heights becoming only shadow of their former glory. The weight of those dependent on the government and the lack of productive citizens eventually created great divisions between those who could do and those who wouldn’t do anything but take. You probably think I’m going to rant about what’s going on in the US right now but I’m not!
An example death by success could be the Roman civilization that got so big with so many living around Rome that the government went to extremes to keep the under-employed citizens entertained and occupied. Could it be that our Governments are currently doing something similar with their efforts to keep the stock markets around the world from falling? Are the government actions simply delaying the inevitable major correction? Could it be that the longer they try to artificially stimulate in an attempt to assure the upward trajectory continues that at some point there will be a huge tipping point that leads to a super correction? Could that happen this year or next? Will it simply be a huge fast drop or will it turn into a worldwide depression breaking every market in the world? Hmmm…
Share Your Success: Many of you have sent me notes regarding the success you are having with the Active Trend Trading System. Please send your stories to me at dww@activetrendtrading.com or leave a post on the website. Thanks!


