Good Day Traders,
1 Month Trial Membership details HERE.
I was in a wonderful conference since Friday afternoon so I’m going to be short with the Report this weekend.
General Market Observation: After weeks of trudging upward every one of our tracking Indexes finally carved out a high resistance price. The Indexes have provided the first weekly reversal candles on two out of three of the Indexes. Remember when price shows these reversal patterns that the magnitude of the potential reversal is not known. We estimate how far prices may pullback based on what has happened in the past. At this point I would be looking for pullbacks as opportunities to move into bullish trades.
SPX: Take a look at the weekly chart and last week’s price action finished with a Bearish Harami reversal signal. For several weeks I have been highlighting that the internals were lagging the actual price action on all three Indexes so a reset may be in the offing with a pullback or a stalling move until moving averages catch up. A lateral stalling move would be out of line with the recent Index character. The recent character was a solid pullback after the upward move was complete. Look at the highs in June, September and December and the resulting pullbacks and how they actually overshot close support.
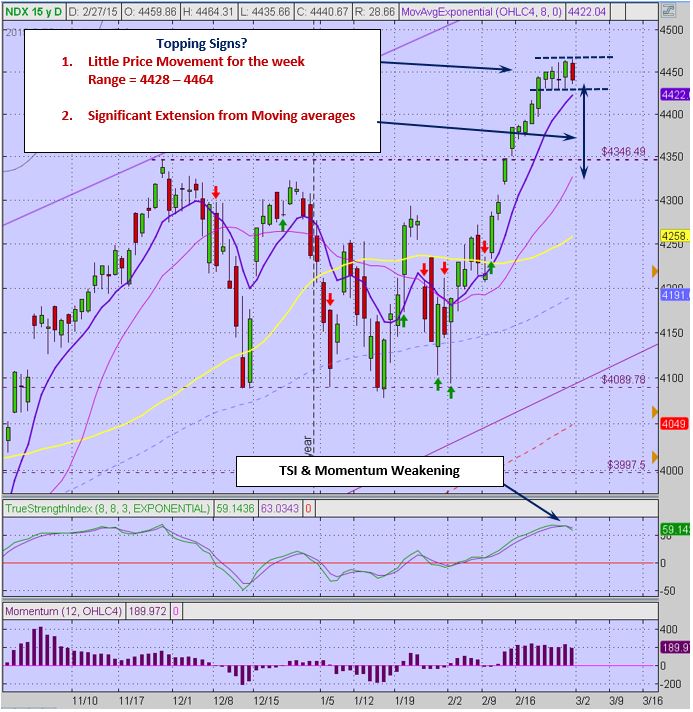
NDX: Very similar action to the S&P. Price for the past 5 days ranged in a zone between 4428 and 4464. Friday’s Bearish Harami Doji may be a warning that price is ready to pullback and reset on this Index. Both the daily and weekly charts are coming into synch which will be an additional clue for determining direction over the next few weeks. If I were to trade any of the Index ETF’s to the downside at this time it would be either Nasdaq or the Russell because current prices have further to fall to levels of solid technical support.
RUT: Resistance at 1240 is in place with support at 1229. Price may ping pong around in this zone or break out in either direction. Price looks to be in synch with the NDX. A pullback target would be between 1210 and 1220. Again consider the recent character of the Index since November most of the pullbacks have overshot and dropped to older support levels. If price continues to retest the highs early this week and stall, that would be a potential clue for a quick downside trade.
If you have not had a chance to check out the research Mike Trager and I have done to start the EWA service you can find a short 10 minute preview at: http://youtu.be/MgC9GMAWh4w
If simplifying your life by trading along with us using the index ETF is of interest you can get the full background video at: https://activetrendtrading.com/etf-early-warning-alerts-video/
Remember if you are a premium or Early Warning Alert member you can receive Text Alerts and Trade Notifications if you send us your mobile phone number. Sent us your number with NO HYPHENS please and we’ll get you on the Text Notification List.
The How to Make Money Trading Stock Show—Free Webinar every Friday at 10 a.m. PDT. This weekly live and recorded webinar helped traders find great stocks and ETF’s to trade with excellent timing and helped them stay out of the market during times of weakness.
The “How to Make Money Trading Stocks” Show is back this Friday, March 6th
Ensure you get a seat by registering now at: https://attendee.gotowebinar.com/register/2664430399782501633
To get notifications of the newly recorded and posted Market Stock Talk every week subscribe at the Market Tech Talk Channel: https://www.youtube.com/channel/UCLK-GdCSCGTo5IN2hvuDP0w
- The Active Trend Trader Affiliate Program is ready. For more information or to become an Affiliate please register here: https://activetrendtrading.com/affiliates-sign-up-and-login/
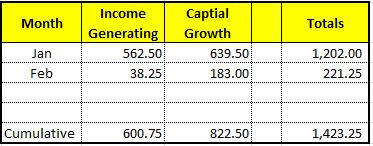
Summary of Monthly Closed Trades as of the Feb 27th:
Invested at 14.5%
Total Booked Profits since Jan 1 when the timing service began: $1,423.25
_______________________________________________________________
ATTS Returns for 2015 through Feb 27th
Margin Account = +1.5%
IRA Account = +4.5% (currently trading the IRA with the same rules but have been testing out the Option Strategies we’re introducing this week)
Early Warning Alerts = +1.97%
Active Trend Trading’s Yearly Objectives:
– Yearly Return of 40%
– 60% Winning Trades
For a complete view of specific trades closed visit the website at: https://activetrendtrading.com/current-positions/
Updated at the beginning of each month.
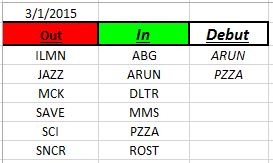
Outs & Ins: ARUN and PZZA make their yearly debut to the IBD 50. Neither are strangers to this list and have been on the list in past years. ARUN made a huge run after earnings last week and is now at all-time highs. The upside volume was huge for three days. PZZA is one of those puzzlers in that last week’s price action was bearish for the stock. Four days of selling pressure around earnings resulted in a bearish engulfing pattern on the weekly chart.
Earnings are almost over for stocks on the IBD 50. AMBA, NOAH (we think) and ULTA will report over the next two weeks.
Comments and opinions written below this line of text may be provocative and only obliquely related to trading. Some may find these “Off the Wall” comments challenging to their outlook on life. I will not post any comments made on subject matter below this line, so if you disagree blast away.
OFF THE WALL
Off the Wall: No Off the Wall this Weekend.
Share Your Success: Many of you have sent me notes regarding the success you are having with the Active Trend Trading System. Please send your stories to me at dww@activetrendtrading.com or leave a post on the website. Thanks!


