Good Day Traders,
Thanks for all the great comments about the ATTS service and the “How to Make Money Trading Stocks” webinar that blast out every Friday at 10 a.m. Pacific. Please let others know about this great webinar! You can either join live or catch the replay on YouTube.
Here’s the link for next Friday’s Show: https://attendee.gotowebinar.com/register/5201819564986755330
For Premium Members our Wednesday evening training is developing some fantastic traders!
Mid-Week Market Sanity Check Topic: 3 Focus Strategies of Active Trend Trading
__________________________________________________________________
In this weekend’s edition of the Trader’s report there is a great article by Mike Trager about market cycles. As many of you know we have been highlighting the weakness of the market internals for several months as we see the market going higher on vapor! This week’s Fed meeting may provide some clues as to how much longer that illustrious organization will kick the can down the road and put off interest rate increases. As always, we shall see the proofs in the price action!
_____________________________________________________
Mike’s Macro Market Musings
Topic: Chart in Focus – The Magic of 150 Months
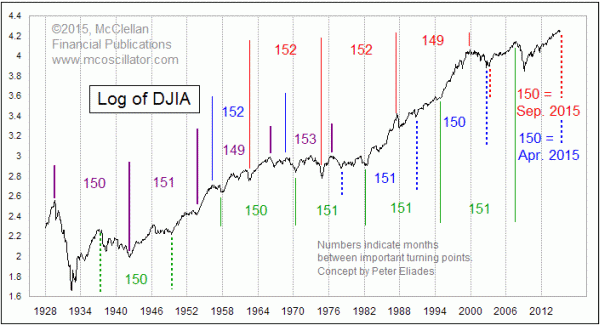
While there is never a guarantee of anything in the financial markets, and while central bank interventions the past several years have created distortions in the markets that have interrupted or pre-empted many historical patterns and tendencies, I nonetheless find it interesting to consult history as a guide to potential intermediate and longer term forecasts, especially since I don’t subscribe to the point of view that it is different this time. One interesting pattern that I have only recently discovered (thanks to McClellan Financial Publications) is that for nearly one hundred years, an interval of 150 months (12.5 years) shows up in lots of places as the time distance between several important turning points for stock prices.
The price data in the chart this week is the log value of the monthly close of the DJIA. Using log scaling allows us to better see the turning points without the effect of arithmetic scaling interfering with the view.
Readers should understand that this is not meant to show a 150-month cycle persisting throughout history. Rather, it is an interesting coincidence that if you count forward by about 150 months from almost any major price turning point (high or low), you find another one, although not necessarily of the same type. There are probably even more such relationships than just the ones shown here.
The 150-month period is related to a longer 393-month turning point pattern by virtue of the Fibonacci ratio. Multiply 150 times 2.618 and you get 393. Alternatively, if you multiply 393 by 0.382, you get 150. It works backwards and forwards.
This is all potentially relevant at the moment because we are arriving at the 150 month anniversary of the 2002-2003 lows. The Internet bubble’s collapse led to a big decline in 2002, and to a bottom in October 2002. But worries about an impending war with Iraq kept prices down, and we got another low in March 2003. So which one do we count from?
That’s the hard question. Counting forward 150 months from October 2002 gets us to April 2015. And 150 months from March 2003 gets us to September 2015. Split the difference, and we have May to July 2015, and that’s right where we sit now.
Understand that the 150-month figure has to be taken with a tolerance of plus or minus 2 months. Life is just not as precise as we might all like. It is not yet clear which of the bottoms in 2002-03 was the one the market thinks is the right one from which to count forward. We’ll know for sure in a few months, but for now we have to allow for either possibility.
Expecting a major top in 2015 fits well with other historical patterns and tendencies in the U.S. stock markets. While not a prediction or recommendation of anything, perhaps a curious finding to tuck away in the back of your mind as you periodically review your longer term weekly and monthly charts
General Market Observation: Oh Boy, its Fed Week! What will this group of soothsayers do regarding rates? Will they acquiesce to the IMF request and delay rate hike until 2016? If the Fed delays a year that could make for some great fireworks going into a presidential election year. A speculation is that even with small controlled interest rate hikes the market will not react well. At this point it does not seem that a potential rate hike is cooked into the market. If the hike doesn’t happen in 2015 it will merely delay the devastation in my humble opinion. Eventually the bubble will burst!
The tracking indexes are somewhat mixed with staying power going to the Russell. This leadership role will not last long if rates are raised on Wednesday. The other major mover for the indexes is option expiration that happens on Friday. So we could see a topsy-turvy week.
SPX: From a purely technical viewpoint the S&P looks like more downside is in order due to the Evening Star bearish candlestick pattern formed on Thursday and Friday. One thing that may lessen the significance of this clue is that the uptrend being reversed is only 3 days long. So the signal is valid but potentially may not result in a huge drop and price may settle at either the 100 day EMA or 2072 the most recent swing low. The next major level of support would be around 2050 which coincides with the 200 day moving average.
The S&P and the other indexes are stuck between support and resistance so if one is trading the index ETF’s either leveraged or non-leveraged wait until the extremes are hit to trade. This reduces risk and provides clear price levels to plan around.
Preferred ETF’s: SPY and SPXL
NDX: Friday’s price action closed just below the 50 day EMA. The weakness in this index showed itself on Thursday when the rebound failed to move up to the downtrend resistance line connecting past highs. While Friday’s sell-off could have been worse, we must be aware that gap downs on any index is not a sign of a healthy index! If trading QQQ or TQQQ waiting for support is appropriate.
Preferred ETF’s: QQQ and TQQQ
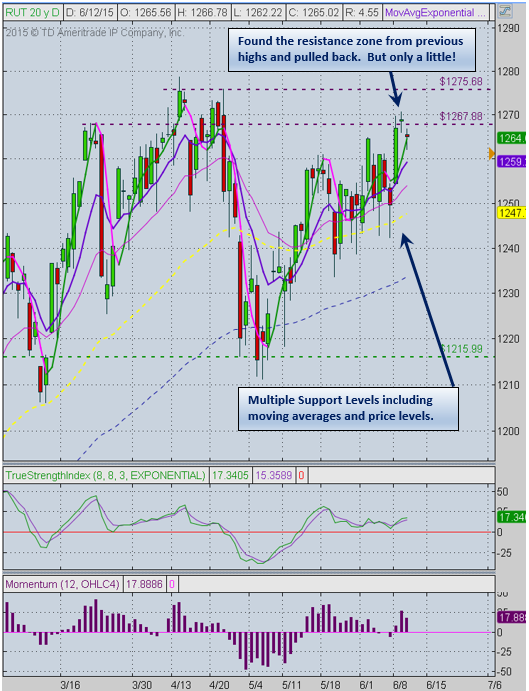
RUT: Last week the Russell held up better than the other two tracking indexes. Price bounced off the 50 day EMA two days which turned out to be excellent trading opportunities. Price then rebounded into the resistance zone of the yearly highs and dropped back down on Friday. On the daily chart there was no major clues of weakness only more evidence of a range bound index bouncing between horizontal levels of support and resistance. Observing the slope and spread on the daily moving averages we can say that there is an upward bias to the Russell for now. On the weekly chart however, last week’s candle is a Hanging Man reversal candle pattern. This week I’ll be treating last week’s price action range as a trading zone and plan appropriate trades on either IWM or TNA. The current weekly range on TNA was just at 7% and has been at this level for the past 6 weeks. Until the upward bias is broken planning the trades off support is a solid strategy.
Preferred ETF’s: IWM and TNA
_______________________________________________________________
ATTS Returns for 2015 through June 12, 2015
Less than 0.0 % Invested
Margin Account = +3.0 % (Includes profit in open positions)
Early Warning Alerts = +5.32%
Active Trend Trading’s Yearly Objectives:
- Yearly Return of 40%
- 60% Winning Trades
For a complete view of specific trades closed visit the website at: https://activetrendtrading.com/current-positions/
Updated at the beginning of each month.
___________________________________________________________
For our all Active Trend Trading Members here’s how we utilize our trading capital
Trading Capital Setup and Position Sizing: Every year we start the year off trading a $100K margin account make the math really easy for yearly returns.
- Each trader must define their own trading capital in order to properly size trade positions to their own risk tolerance level!
- The $100K account is split between up to 4 stocks and a leveraged Index ETF. Actual number of shares will vary of course depending on price of the entity traded. We have found that limiting open positions to only 5 entities greatly reduces the trade management time requirements for members. This goes back to our goals of providing a system designed for members who work full time.
- Regardless of market conditions no more than 50% of available margin is used at any time.
- Each Trade is split 50-50 between Income Generating & Capital Growth Objectives unless specified in the Order Alert
- Naked Puts or short term options strategies will be used occasionally for Income Generating Positions
- None of the trade setups are a recommendation to trade only notification of planned trades from set ups using the Active Trend Trading System. Each trader is responsible for establishing their own appropriate risk level on every trade.
The Early Warning Alert Service has hit all three major market trading point this year. See this brief update video for more details: https://youtu.be/PRLmPQLHjiI
If simplifying your life by trading along with us using the index ETF is of interest you can get the full background video at: https://activetrendtrading.com/etf-early-warning-alerts-video/
The How to Make Money Trading Stock Show—Free Webinar every Friday at 10 a.m. PDT. This weekly live and recorded webinar helped traders find great stocks and ETF’s to trade with excellent timing and helped them stay out of the market during times of weakness.
The “How to Make Money Trading Stocks” Show is back this Friday, June 19th
Ensure you get a seat by registering now at:
https://attendee.gotowebinar.com/register/5201819564986755330
To get notifications of the newly recorded and posted How to Make Money Trading Stocks every week subscribe at the Market Tech Talk Channel: https://www.youtube.com/channel/UCLK-GdCSCGTo5IN2hvuDP0w
Pay for your membership become an Affiliate. For more information or to become an Affiliate please register here: https://activetrendtrading.com/affiliates-sign-up-and-login/
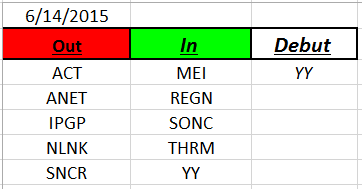
Outs & Ins: YY makes its debut to the IBD 50 this weekend and it extended. This strong growth stock has been on the IBD 50 list in past years and going in to 2015 I didn’t forget about that and kept it on the ATTS go to watch list! Active Trend Traders have been trading this stock profitably since mid-April. This is one of the major benefits of ATTS we focus on strong growth stocks even when they are out of favor with other services and provide trading observations when the clues are coming together weeks and months before the stock makes back into favor!
The stocks that came on the list this weekend are ready for trading at this point. Of the stocks that fell off the list, SNCR has the most interesting pattern.
Comments and opinions written below this line of text may be provocative and only obliquely related to trading. Some may find these “Off the Wall” comments challenging to their outlook on life. I will not post any comments made on subject matter below this line, so if you disagree blast away.
OFF THE WALL
Off the Wall: Had breakfast with a good friend Saturday morning who also trades and loves the Active Trend Trading System. My buddy had just re-read Dr. Alexander Elders classic book from 1993, Trading for a Living. He shared how each time he’s read this great book he comes away with new golden nuggets of trading. As it turns out this was the first major book on trading I read back in 1993 that planted the seed in my mind about the potential of actually one day trading for a living. This is a great book and well worth the read! My friend gave me a fantastic gift which was his bullet notes from his review of Dr. Elder’s book. The nuggets of trading wisdom he captured reminded me of what a great book this is. One of the nuggets that caught my attention as I walked home from the cafe was the topic heading: The Market Is like an Ocean. This fits so well into last Wednesday’s training about The Psychology of You and is worth sharing. Here are the bullets:
Like an Ocean
- The Market is like an ocean—it doesn’t know you exist
- You can do nothing to influence what either the ocean or market will do
- Your feelings of fear or excitement have nothing to do with the market—the exist only for you
- Your feelings about the ocean or market exist only in your mind
- These same feelings will threaten you survival when feelings rather than intellect control your behavior
- You can only control you behavior and your trades—Focus on what you control
Wise nuggets to consider as each of us become Master Traders!
Share Your Success: Many of you have sent me notes regarding the success you are having with the Active Trend Trading System. Please send your stories to me at dww@activetrendtrading.com or leave a post on the website. Thanks.


