Good Day Traders,
Overview & Highlights: I posted a new video on “How to get started with Active Trend Trading & Early Warning Alerts”. This is a brief video for both new members and experienced members to ensure you are maximizing your membership experience with both services. Follow the link below.
Getting Started Link: https://activetrendtrading.com/how-to-get-started/
Webinars: At Active Trend Trading we offer two webinars per week to provide training plus trade and market updates. See the schedule below for the next webinars.
How to Make Money Trading Stocks on Friday, Feb 5th
Register Here: https://attendee.gotowebinar.com/register/2982050729131200513
Next Training Webinar: Feb 2nd
For Premium Members our Tuesday evening training is developing some fantastic traders!
Mid-Week Market Sanity Check Topic: Recognizing Short Set-ups
Managing Existing Trades: Current trades are for Strategy III. Waiting for set-ups for Strategy I & II.
Strategy I Portfolio Building: No Open Trades.
Strategy II Income Generation: No Open Trades—if you trade options this is a good strategy to send up trial trades to see if the market’s direction may be changing. 1-5 contracts of one of the Index ETFs may provide less downside risk than long position in the underlying Index ETF. Trading options is not for everyone and I strongly encourage members to first become successful trading stocks and ETFs.
For members wanting to better understand this Strategy there is a very good training video at: https://activetrendtrading.com/basic-option-strategy/
Strategy III Wealth & Income Generation Trades: Two Foundational Positions are in place to sell weekly options against. The recalculated weekly revenue needed from these foundational positions was forward in an update report earning last week. My objective with this Strategy is to collect enough weekly premium during the life of the LEAPS Strangle on both SPY and TSLA to both pay for the capital invested and gain between 50% – 100%.
Trade 1: Foundation Position is 4 contracts of SPY Jan17 205C and 4 contracts of SPY Jan17 200P.
Opened partial position selling 2 SPY Feb1 193C collecting a premium of $1.88; Potential Gross Revenue = $376
Last week results: +$232
YTD Trade 1 has cleared profits of $1004.00
Trade 2: Long TSLA Jan17 250C & Long Jan17 220
Last week results: -$345.00
YTD Trade 2 has cleared profits of $569.00
Waiting for Weekly set up for TSLA. Earnings on Feb 10th.
The Early Warning Alert Service hit all eight major market trading points in 2015. See this brief update video for more details: Early Warning Alerts Update Video or at https://youtu.be/GJwXCL4Sjl4
If simplifying your life by trading along with us using the index ETF is of interest you can get the full background video at: https://activetrendtrading.com/etf-early-warning-alerts-video/
General Market Observation: The indexes are currently trading in spurts that are challenging to time because traditional set-ups are not appearing. If you have been kicking yourself for not trading some of these big daily moves a word of advice—Stop It! When trading price action that moves up big one day down big the next and the moves are primarily gap ups and downs it requires traders to place a trade at the close betting price action will move the opposite direction the next day. This is a high risk venture that can back fire quickly. I know it’s tempting but waiting for higher probability set-ups will provide stronger rewards in the long run.
I thought the following from IBD’s weekly Big Picture summed this week up fairly well. Emphasis added. “During another wild week of trading, fund managers reacted to the Federal Reserve’s first meeting in 2016 on interest-rate policy, a rebound in crude oil prices, a subpar 0.7% preliminary increase in Q4 U.S. GDP, and the Bank of Japan’s decision to join the ECB in charging banks for parking their cash in the economic superpower’s central bank.”
Reactionary says a lot about what’s going on in the current market. From the perspective of the existing global economy and longer term outlook none of these events can be considered positive and their impact on the Indexes may be short lived at best. Restating the main point of the first paragraph, the challenge is finding the proper action point if attempting to trade the Index ETFs in either direction. While Friday’s action was dramatic it serves as the initial surge back up into strong areas of resistance and we can expect the upward move to stall at some point. The stall out will lead to one of two outcomes, a continuation of the current downtrend or a retest that will lead to a stronger rebound. On the charts the initial retreat will look the same.
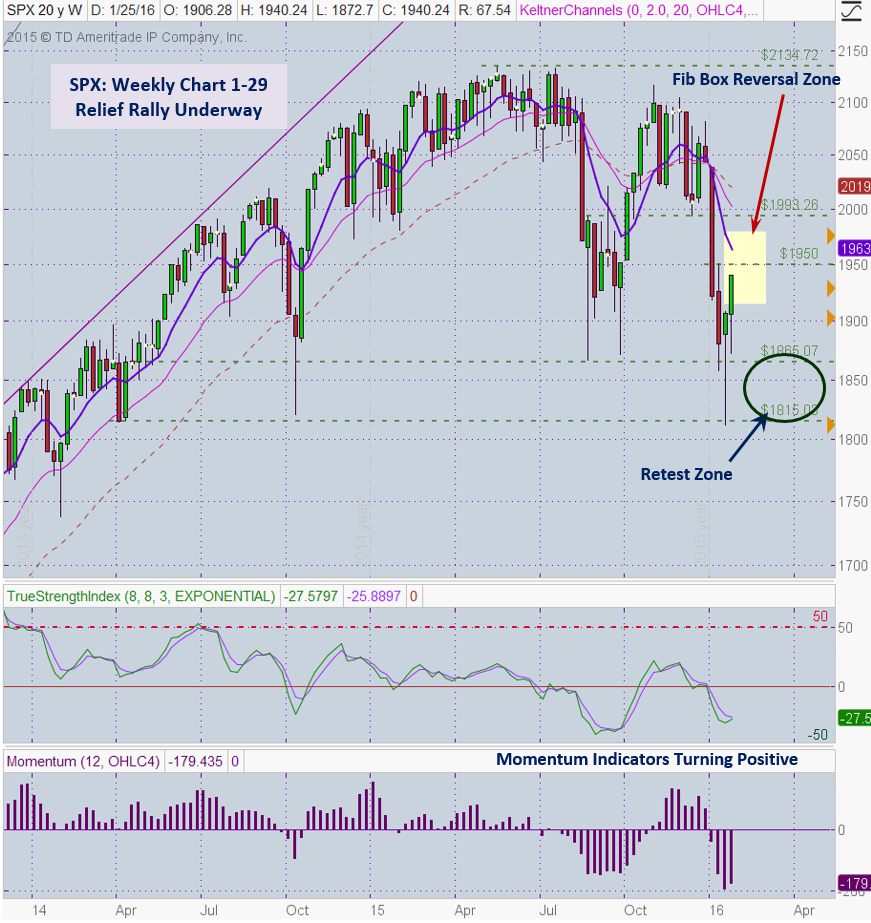
The weekly chart below shows that price action on the S&P is driving up towards the 8 week EMA. It appears that a collision of these two will take place around the 1850 level. In the past price action has had a tendency to overshoot resistance and then slow. When it slows we’ll pay looking for signs of stalling out. Additionally the top of the Fib Box at the 61.9% retracement will serve as resistance at the 1980 level. Above the Box the strongest level of resistance will be at the swing low of 1993.
An upside trigger would take place if price retest into the mid-section of Friday’s candle. This level is very close to the 38.2% retracement on the Fib Box. Interesting how those kind of things work out! With the current swing low of 1812 being 7% away stop losses on any long trade must have stops based on other technical levels. An example of this would be a drop to around the bottom of the Fib Box could trigger a long trade. If price drops below that bottom of the Box would be an appropriate stop.
Both the NDX and RUT are lagging the S&P in the move higher but showing similar characteristics for how to trade. The S&P and NDX are currently in a short uptrend swing but a longer term downtrend. The RUT is still in a downtrend having not put in a higher swing low.
Trading the Indexes over the next few days and weeks will require short holding periods if we want to take advantage of the trading spurts. For our members trading these spurts can be profitable but they can also lead to whipsaw and heightened conditional order requirements. If this higher paced trading does not fit your schedule then cash is a great place to be. There is nothing wrong with waiting for more stability to enter the market.
SPX: Downside Market Short the SPY, SPY Puts or SPXU.
Preferred Long ETF’s: SPY, UPRO and SPXL
NDX: Downside Market Short the QQQ, QQQ Puts or SQQQ.
Preferred Long ETF’s: QQQ and TQQQ
RUT: Downside Market Short the IWM, IWM Puts or TZA.
Preferred Long ETF’s: IWM and TNA
The How to Make Money Trading Stock Show—Free Webinar every Friday at 10 a.m. PDT. This weekly live and recorded webinar helped traders find great stocks and ETF’s to trade with excellent timing and helped them stay out of the market during times of weakness.
How to Make Money Trading Stocks on Friday, Feb 5th
Register Here: https://attendee.gotowebinar.com/register/2982050729131200513
To get notifications of the newly recorded and posted How to Make Money Trading Stocks every week subscribe at the Market Tech Talk Channel: https://www.youtube.com/channel/UCLK-GdCSCGTo5IN2hvuDP0w
- The Active Trend Trader Referral Affiliate Program is ready. For more information or to become an Affiliate please register here: https://activetrendtrading.com/affiliates-sign-up-and-login/
Index Returns YTD 2016
I’ve added a column to the Index YTD performance chart. The column on the far right shows the depth of the current correction with respect to the highs of the top from 2015. Currently RUT is in Bear Market Territory.
ATTS Returns for 2016 through Jan 29, 2016
Percent invested $100K account: Strategies I & II invested at 0%; Strategy III invested at 20%.
Current Strategy Performance YTD (Closed Trades)
Strategy I: Down -407.85 or -0.58%
Strategy II: 0%
Strategy III: Up $1573 or +7.9%
Cumulative YTD: 0.4%
Active Trend Trading’s Yearly Objectives:
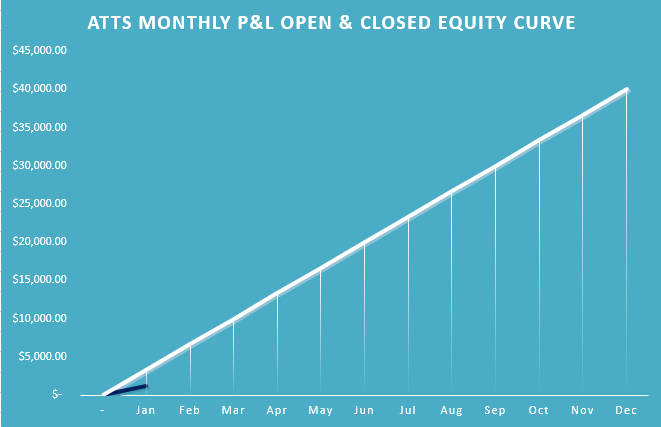
- Yearly Return of 40%
- 60% Winning Trades
- Early Warning Alert Target Yearly Return = 15% or better
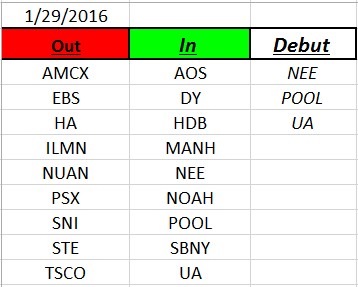
Outs & Ins: NEE, POOL and UA make their debut on this week’s IBD 50. NEE broke out after earnings last week and is still close to the breakout level. POOL is at resistance with earnings coming on 2/18 BMO. UA which has been on the list in past years. UA reacted well to earnings but is still below the 200 day moving average. May be worth watching for further base building action.
There are 39 out of the 50 members of this list that will be reporting through the mid-part of March. This week IDTI, PBH and EW report. From the Leaderboard, GOOGL report AMC on Monday, 2/1. Some additional leaders that are currently basing include: IDTI, EEF, ORLY, GGAL, XRS, ELLI, & EW.
Comments and opinions written below this line of text may be provocative and only obliquely related to trading. Some may find these “Off the Wall” comments challenging to their outlook on life. I will not post any comments made on subject matter below this line, so if you disagree blast away.
OFF THE WALL
Off the Wall: Reposted from: Business Insider, by: Elena Holodny. This post captures how even really smart humans are still held captive to human nature which encompasses “fear & greed”. Our trading plans and campaigns must account for human nature
Isaac Newton was one of the smartest people to ever live. But there’s a big difference between being a smart physicist and smart investor. And, unfortunately for him, Newton learned that the hard way.
In an updated and annotated text of Benjamin Graham’s classic “The Intelligent Investor,” WSJ’s Jason Zweig included a small anecdote about Newton’s adventures with investing the South Sea Company:
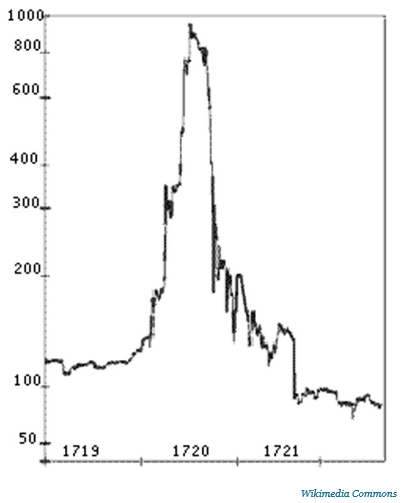
“Back in the spring of 1720, Sir Isaac Newton owned shares in the South Sea Company, the hottest stock in England. Sensing that the market was getting out of hand, the great physicist muttered that he ‘could calculate the motions of the heavenly bodies, but not the madness of the people.’ Newton dumped his South Sea shares, pocketing a 100% profit totaling £7,000. But just months later, swept up in the wild enthusiasm of the market, Newton jumped back in at a much higher price — and lost £20,000 (or more than $3 million in [2002-2003’s] money. For the rest of his life, he forbade anyone to speak the words ‘South Sea’ in his presence.”
Here’s a look at how South Seas moved back then.
Newton obviously wasn’t a dumb person. He invented calculus and conceptualized his three laws of motion.
But this little episode shows that he wasn’t a smart investor because he let his emotions get the best of him, and got swayed by the irrationality of the crowd.
Or as Graham described it: “For indeed, the investor’s chief problem — and even his worst enemy — is likely to be himself.”
Share Your Success: Many of you have sent me notes regarding the success you are having with the Active Trend Trading System. Please send your stories to me at dww@activetrendtrading.com or leave a post on the website. Thanks.
For our all Active Trend Trading Members here’s how we utilize our trading capital
Trading Capital Setup and Position Sizing: Every year we start the year off trading a $100K margin account split up into the three strategies used with the Active Trend Trading System.
- Each trader must define their own trading capital in order to properly size trade positions to meet their own risk tolerance level!
- Strategy I: Capital Growth—70% of capital which equates to $140K at full margin. This strategy trades IBD Quality Growth Stocks and Index ETFs. Growth Target 40% per year.
- Strategy II: Short Term Income or Cash Flow—10% of capital or $10K. This strategy focuses on trading options on stocks and ETF’s identified in Strategy I. The $10K will be divided into $2K units per trade.
- Strategy III: Combination of Growth and Income—20% of capital or $20K. This strategy will use LEAPS options as a foundation to sell weekly option positions with the intent of covering cost of long LEAPS plus growth and income.
- The $70K Strategy I portion of the trade account is split between up to 4 stocks and potentially a leveraged Index ETF. Actual number of shares will vary of course depending on price of the entity traded and amount of margin available. We have found that limiting open positions to only 5 entities greatly reduces the trade management time requirements for members.
- Naked Puts or short term options strategies will be used occasionally for Income Generating Positions
- None of the trade setups are recommendations to trade only notification of planned trades from set ups using the Active Trend Trading System. Each trader is responsible for establishing their own appropriate risk level if they decide to parallel trade.
- The Active Trend Trading System objective is to provide a clear and simple system designed for members who work full time.
For a complete view of specific trades closed visit the website at: https://activetrendtrading.com/current-positions/
Updated first full week of each month.
