
Good Day Traders,
The Orlando World Money Show was great watched some very good presentations and best of all met some fantastic folks! We had the opportunity to see FBN’s Making Money with Charles Payne live TV show. Now I don’t usually watch this it was a fun change of pace and I sat next to a floor trader from the CME who goes by WACO. He is often interviewed on FBN and other channels about trading. WACO asked me what I thought of the show and I told him I don’t watch the Business networks to trade. He said, “That is wise, most of the noise on the business channels is for entertainment!” One of the panelist recommendations was DIS which broke out after earnings—wonder if she was playing to the Orlando crowd.
General Market Observation: If you’ve read anything on the Indexes this weekend you know prices are stuck in a box or trading range. Price hit the top of the range on Thursday and Friday tried to break out but then fell back. The zones of support and resistance are very well defined. So until we break out one way or the other trading building a large position in any entity will probably be challenging. We move into the midpoint of earnings season and expect stocks that surprise in a positive manner to be rewarded and those which have smallest kink will be punished!
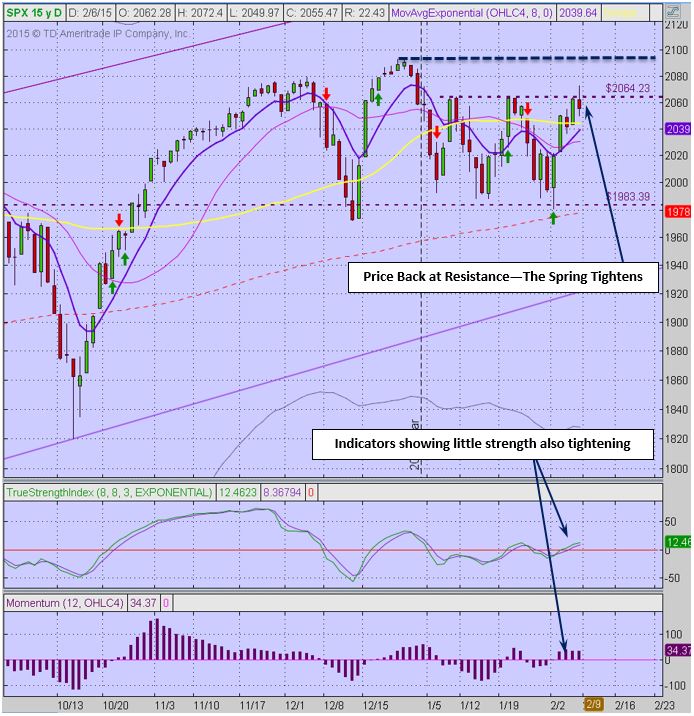
SPX: Try as it might the S&P could not stay above the 2065 resistance zone and finished Friday with a Bearish Harami Reversal candlestick pattern. On the weekly chart the range totally engulfed the past four weeks but does not represent a reversal candle. If this Index respects its current character this week should be a sell off to support zone between 1980 and 2000. A few years ago the SPX consolidated in a range like this for several months and every time it hit the bottom of the range it bounced into a tradable move back to resistance where it could be sold for a profit. When an index behaves in this manner traders can get some great short term gains by just trading the bounces. Take a look at SPXL the 3x Leveraged ETF of the S&P. While the range on the S&P is just below 4% on SPXL the range is a bit over 12%. As long as the Index maintains its current character these are viable trades.
The daily chart below shows little strength to take prices higher. Now if we do get a big surge next week and power comes back in then our posture will change accordingly. While it is a bit early to put much credence in the Futures market price a currently down and if maintain this negative bias we could start tomorrow off with an Evening Star Bearish Reversal signal. But we’ll check the pre-market to see if this biases last through the night.
NDX: The Nasdaq 100 remains the weakest of our tracking Indexes. The weekly range was constrained and Friday’s price action resulted in a Bearish Engulfing reversal pattern. If this pattern completes on Monday and the Index maintain its current character expect a fall back the support zone around 4100. If this level fails then watch the price action at the uptrend channel line and the 200 day SMA.
Over the past couple of years every time price has dropped to the 200 day SMA the Nasdaq and reversed back into a strong move. However the current price action appears to be different than those other times. Could these differences be signaling topping action which leads to a more negative character? We shall see. Right now support and resistance is holding.
RUT: The sideways action in the Russell has been going on longer than either of the other two tracking Indexes. Price found the ceiling on Friday and reversed. While this was not a reversal candle it does show that the end of the surge back to resistance may be over and the elevator is going back to the ground floor at about 1160. The current trading range on the Russell is about 5% and just under 15% on TNA the 3x leveraged ETF of the Russell.
If a trader wants to take advantage of these moves take you trading triggers from either the IWM or RUT directly. Conditional orders can be set up to trigger off IWM or RUT and execute trades for TNA. The main reason to use the IWM and RUT for triggers is because their price action paints a truer picture of support, resistance and interaction with the moving averages. This is just one of the wrinkles in trading TNA.
_________________________________________________________
If you have not had a chance to check out the research Mike Trager and I have done to start the EWA service you can find a short 10 minute preview at: http://youtu.be/MgC9GMAWh4w
If simplifying your life by trading along with us using the index ETF is of interest you can get the full background video at: https://activetrendtrading.com/etf-early-warning-alerts-video/
Remember if you are a premium or Early Warning Alert member you can receive Text Alerts and Trade Notifications if you send us your mobile phone number. Sent us your number with NO HYPHENS please and we’ll get you on the Text Notification List.
The How to Make Money Trading Stock Show—Free Webinar every Friday at 10 a.m. PDT. This weekly live and recorded webinar helped traders find great stocks and ETF’s to trade with excellent timing and helped them stay out of the market during times of weakness.
There will be no “How to Make Money Trading Stocks” Show on February 6th because David and I will be at the World Money Show!
To get notifications of the newly recorded and posted Market Stock Talk every week subscribe at the Market Tech Talk Channel: https://www.youtube.com/channel/UCLK-GdCSCGTo5IN2hvuDP0w
- The Active Trend Trader Affiliate Program is ready. For more information or to become an Affiliate please register here: https://activetrendtrading.com/affiliates-sign-up-and-login/
Summary of Monthly Closed Trades as of the Feb 6th:
The Margin Account is in Cash.
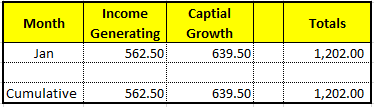
Total Booked Profits since Jan 1 when the timing service began: $1202.00
_______________________________________________________________
ATTS Returns for past 3 Years—Each account is now reset to $100K to begin 2015!
Since 2012 we have traded the Active Trend Trading System with the following net performance. Sharing this data is not a representation that similar results will continue in the future:
2012: 24.98%
2013: 41.1%
2014: 28.16%
Compounded Return = 126% for the three years or an average of 31.41%/Year
Active Trend Trading’s Yearly Objectives:
– Yearly Return of 40%
– 60% Winning Trades
For a complete view of specific trades closed visit the website at: https://activetrendtrading.com/current-positions/
Updated at the beginning of each month.
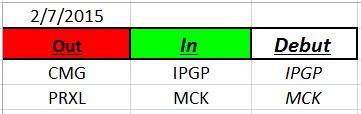
Outs & Ins: IPGP and MCK make their debut on this week’s IBD 50. IPGP is breaking from a long term consolidation pattern on improving volume but is extended. MCK has been on the list in past years and broke out above resistance at 220 on earnings last week. MCK is a slow and steady mover that finds support at the 50 and bounces.
Forty percent of the IBD 50 will report over the next three weeks. The notables that report this week are AAP, UVE, SAVE, CDW and AFSI.
Comments and opinions written below this line of text may be provocative and only obliquely related to trading. Some may find these “Off the Wall” comments challenging to their outlook on life. I will not post any comments made on subject matter below this line, so if you disagree blast away.
OFF THE WALL

Off the Wall: On the flight home last night I was thinking about what it takes to trade for a living. Many traders seek this objective as the ultimate goal of learning to become a master trader. Life would be so simple if I could just watch the market all day and take those trades when they appear! If I could do that I would be a much better trader.
Personally I believe this is a misguided, romanticized idea that can provide a slippery slope to failure and frustration. For whatever reason there is an idea that the work in trading is watching the market all day long waiting for just the right moment. Now this may be true for Day Traders and Scalpers but few people really possess the psychological makeup to for these two types of traders. Yet the bias of belief is that watching the jagged line or bouncing price quote all day long is the real work of trading. If you are contemplating trading for a living—the above mindset for most people is a lie!
The real work for successful trader is done during non-trading hours when we review charts and design strategically sound trades that can in place and function without the need for us to watch them during market hours. But there is the draw of the ticker that pulls us in as if our watching imposes some magic force over the price action. Some never learn to apply this critical piece and fail to learn their systems. Learning to trade properly must be achieved prior to stepping into trading for a living. If it is not then stepping into trading for a living will be a painful experience. We’ll talk about this in one of our upcoming Mid-Week Market Sanity Checks.
Share Your Success: Many of you have sent me notes regarding the success you are having with the Active Trend Trading System. Please send your stories to me at dww@activetrendtrading.com or leave a post on the website. Thanks!