
Good Day Traders,
Overview & Highlights: Great news for all Early Warning Alerts and Active Trend Trader Members. This year the EWA system has flashed two alerts but failed to provide a proper buy signal. We went back to work looking for an enhanced primary entry trigger that would better complement the standby alert trigger regardless of the market condition. The standby alert trigger has worked flawlessly at each of the market bottoms since 2002 but often required waiting until other signals triggered before entering. We were successful in our testing and will be using this trigger going forward as an enhancement to the EWA System. Our work also provides additional benefits by providing improved timing for “Second Chance” entries with the EWA’s and improved entry timing for each of the 3 Strategies of the Active Trend Trading System.
As always my objective is to Clarify and Simplify and this minor refinement will accomplish both so we can all multiply!
Webinars: At Active Trend Trading we offer two webinars per week to provide training plus trade and market updates. See the schedule below for the next webinars.
How to Make Money Trading Stocks on Friday, March 11th
Register Here: https://attendee.gotowebinar.com/register/2294699831932429315
Next Training Webinar: March 9th
For Premium Members our Wednesday evening training is developing some fantastic traders!
Mid-Week Market Sanity Check Topic: ATTS Indicators and How to Use Them
General Market Observation: Do you feel that beckoning call of the Indexes this past week? That everything is OK and so it must be time to jump into the market with both feet? If you feel the lure ask the simple question—has anything fundamentally changed over the past 3 weeks? The answer is NO! Tuesday’s reversal and strong rebound surprised many technicians including Mike and I. It is a given that the market will surprise occasionally and this was one of those cases. Should this change our overall posture towards the market? No, but we must remain flexible and patience, waiting for this “Sucker’s Rally” to end. We are still in a short-term uptrend within the context of a longer term downtrend.
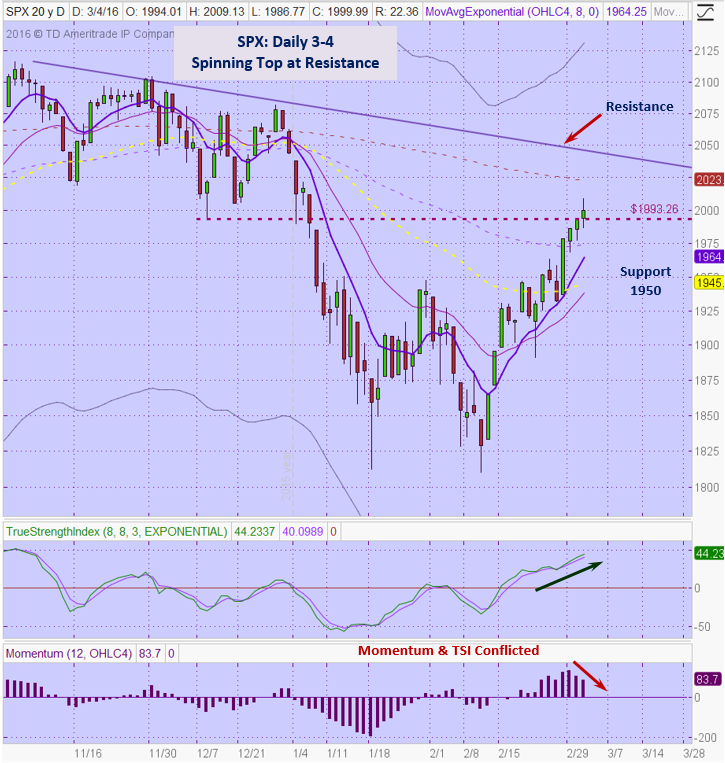
What clues are there that the current upswing is a “Sucker’s Rally”? First the rate of ascent is concerning. The velocity of the current move cannot be maintained without pausing to digest gains. Secondly the volume since the bottom on 2/11 has been below average. This is saying that institutions have not been buying in a big way. In fact the Accumulation rating on the Indexes is an “E” the lowest rating. Also notice on the chart below how Friday’s candlestick is a spinning top at a strong resistance zone. This tell us that it may be time for a rest or pullback or rollover. Last clue is the conflicting story between the daily TSI and Momentum. Notice how Momentum was trending lower through the end of last week while TSI was moving up. This negative divergence between indicators is telling us that the force behind the current rally may be waning.
I will use the leveraged Index ETF’s to time some of the potential long or short side trades for the Index ETFs. Each of the leveraged Index ETFs for the Tracking Indexes is either above or at the 10% upper envelope of the 20 day EMA. This is a clear signal not to buy at current levels and if a downside trade sets up to take it for a retracement at least to the 20 day EMA. If Friday represents a swing high then a 38.2% retracement from this high to the low on 2/11 would take the S&P back to the 1932 level. This just happens to correspond with the bounce low from last Tuesday! A break of the 38.2% level opens the potential of falling lower to around support at 1900 which is in between the 50% and 61.8% retracement.
The Nasdaq 100 ended last week with another stalling Spinning Top Doji at a resistance zone. Friday’s candlestick followed two Hanging Man reversal candles. The resistance zone around the 100 day moving average is strong. A failure here would potentially lead to a retracement back to the 8 week moving average that just happens to be just below the 23.6% retracement. A deeper fall would find support between 4177 and 4100. If there is a reversal a trade in SQQQ may provide solid short term results.
The Russell performed well last week but finished Friday below the 100 day moving averages after an attempted breakout above this moving average. Like the other two Indexes the Momentum and TSI are conflicted. A move to the 38.25 retracement level at 1032 would represent a test of the breakout from this level.
SPX: Downside Market Short the SPY, SPY Puts or SPXU.
Preferred Long ETF’s: SPY, UPRO and SPXL
NDX: Downside Market Short the QQQ, QQQ Puts or SQQQ.
Preferred Long ETF’s: QQQ and TQQQ
RUT: Downside Market Short the IWM, IWM Puts or TZA.
Preferred Long ETF’s: IWM and TNA
The How to Make Money Trading Stock Show—Free Webinar every Friday at 10 a.m. PDT. This weekly live and recorded webinar helped traders find great stocks and ETF’s to trade with excellent timing and helped them stay out of the market during times of weakness.
How to Make Money Trading Stocks on Friday, March 11th
Register Here: https://attendee.gotowebinar.com/register/2294699831932429315
To get notifications of the newly recorded and posted How to Make Money Trading Stocks every week subscribe at the Market Tech Talk Channel: https://www.youtube.com/channel/UCLK-GdCSCGTo5IN2hvuDP0w
The Active Trend Trader Referral Affiliate Program is ready. For more information or to become an Affiliate please register here: https://activetrendtrading.com/affiliates-sign-up-and-login/
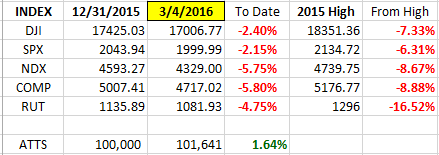
Index Returns YTD 2016
I’ve added a column to the Index YTD performance chart. The column on the far right shows the depth of the current correction with respect to the highs of the top from 2015. Currently RUT is just out of Bear Market Territory.
ATTS Returns for 2016 through March 4, 2016
Percent invested $100K account: Strategies I & II invested at 0%; Strategy III invested at 20%.
Current Strategy Performance YTD (Closed Trades)
Strategy I: Down -659.15 or -0.94%
Strategy II: 1.65%
Strategy III: Up $4247 or +21.2%
Cumulative YTD: 3.7%
Active Trend Trading’s Yearly Objectives:
- Yearly Return of 40%
- 60% Winning Trades
- Early Warning Alert Target Yearly Return = 15% or better
For a complete view of specific trades closed visit the website at: https://activetrendtrading.com/current-positions/
Updated first full week of each month.
For our all Active Trend Trading Members here’s how we utilize our trading capital
Trading Capital Setup and Position Sizing: Every year we start the year off trading a $100K margin account split up into the three strategies used with the Active Trend Trading System.
- Each trader must define their own trading capital in order to properly size trade positions to meet their own risk tolerance level!
- Strategy I: Capital Growth—70% of capital which equates to $140K at full margin. This strategy trades IBD Quality Growth Stocks and Index ETFs. Growth Target 40% per year.
- Strategy II: Short Term Income or Cash Flow—10% of capital or $10K. This strategy focuses on trading options on stocks and ETF’s identified in Strategy I. The $10K will be divided into $2K units per trade.
- Strategy III: Combination of Growth and Income—20% of capital or $20K. This strategy will use LEAPS options as a foundation to sell weekly option positions with the intent of covering cost of long LEAPS plus growth and income.
- The $70K Strategy I portion of the trade account is split between up to 4 stocks and potentially a leveraged Index ETF. Actual number of shares will vary of course depending on price of the entity traded and amount of margin available. We have found that limiting open positions to only 5 entities greatly reduces the trade management time requirements for members.
- Naked Puts or short term options strategies will be used occasionally for Income Generating Positions
- None of the trade setups are recommendations to trade only notification of planned trades from set ups using the Active Trend Trading System. Each trader is responsible for establishing their own appropriate risk level if they decide to parallel trade.
- The Active Trend Trading System objective is to provide a clear and simple system designed for members who work full time.
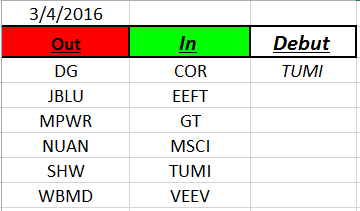
Outs & Ins: TUMI makes its debut on the IBD 50 this weekend. TUMI gapped almost 30% on earnings last week and broke above past resistance. Watch for a retest of this resistance at the $25.47 level.
Like the Indexes much of the move up over the past 3 weeks on the IBD 50 has been on lower volume and falling Momentum. TSI and Momentum indicators are in conflict with the TSI showing strong but Momentum weakening. Many of the stocks are overbought and prices are extended about the 20 day EMA’s. If a stock has enough range to move up to the 20 day moving average envelope and is at or outside the upper envelope band then a pullback may be in the offing. In this case wait for a reversal candlestick.
Five stocks will be reporting earnings in March. These include AYI, FIVE, CALM, PLAY and NKE. NKE looks to be the best candidate for a pre-earnings run and reports on 3/17 AMC.
I like both NKE and STMP for potential long positions from proper buy points.
Share Your Success: Many of you have sent me notes regarding the success you are having with the Active Trend Trading System. Please send your stories to me at dww@activetrendtrading.com or leave a post on the website. Thanks.