Good Day Traders,
Overview & Highlights: Had a great Bay Area Money Maker’s Meeting this weekend! Special Guest Speaker, Lee Tanner spoke on the value of running a Model Portfolio—i.e. Paper Trading one’s rules and learning to let profitable trades run! I’ll be reviewing Lee’s presentation for any golden nuggets that can be added to Active Trend Trading going into 2016. Additionally, this week’s newsletter has an excellent article from Mike Trager on Market Seasonality and the Prevailing Bad Breadth in the current market. Mike’s observations are always a welcome addition and bring insight from years of market experience.
Webinars: At Active Trend Trading we offer two webinars per week to provide training plus trade and market updates. See the schedule below for the next webinars.
How to Make Money Trading Stocks on Nov 13, 2015.
Register Here: https://attendee.gotowebinar.com/register/4019475132496560386
Next Training Webinar: Nov 11, 2015
For Premium Members our Wednesday evening training is developing some fantastic traders!
Mid-Week Market Sanity Check Topic: Finish 2015 Strong—Prep for 2016
Mike’s Macro Market Musings: Seasonality & Bad Breadth
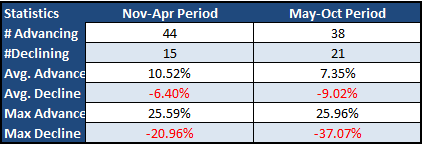
We are now entering the time of year which historically is often considered the sweet spot for U.S. equities. The period from November – April is the time during which the U.S. stock markets traditionally enjoy most of their gains. Between May – October, the markets as measured by the commonly followed equity indexes often tend to struggle overall, resulting in the well known and timeworn cliché of “sell in May and go away”. This year the price action in the U.S. equity indexes has certainly honored this tradition. For some longer term perspective, the following table, derived from Federal Reserve data going back 59 years to 1957, will provide some statistical evidence to either support or refute the aforementioned notions:
Some simple arithmetic here can yield a few practical and useful conclusions. One is that while it is true that approximately 75% of the time the period from November – April produces an average gain of 10.52% in the S&P 500, this is no guarantee of anything since about 25% of the time an average loss of 6.4% is experienced. And, despite the “sell in May” axiom, more often than not (in fact, more than 60% of the time), the period between May – October is positive overall, although not quite as positive as the November – April period. One can draw their own conclusions as to how to put this information to use.
For some additional context, I find the following factoid interesting even if not actionable – the current bull market, which is generally acknowledged to have begun off the cyclical lows in March, 2009, is now more than 6 1/2 years old and has produced more than a 200% increase in the S&P 500 and more than a 300% rise in the Nasdaq composite (thank you, Mr. Bernanke and Ms. Yellen). In the past 100 years or more there have only been 2 other instances when a bull market lasting 6 years produced index gains in excess of 200%. These prior 6 year periods ended in 1929 and 2000. Most of us remember what happened in 2000 – 2003; I believe Dennis may be one of the few who can recall 1929. While a sample size of two does not provide any statistical significance at all, caveat emptor.
This past month of October has presented a remarkable rally in equity indexes that has resulted in the largest one month point gain in the S&P ever in the history of the U.S. equity markets; that’s right, the largest ever. On a nominal basis, that is, if not on a percentage basis. It’s as if the remarkable down day in late August never happened, and the global macro reasons triggering it have all been miraculously resolved. And the above discussion on seasonality will logically lead many to conclude that further gains are in store during the coming months, which could very well turn out to be true. However, there may be a glitch in this thesis.
The potential problem with this recent rally is one Dennis and I have commented on before, and it has to do with bad breadth – not the kind that can be treated with a rinse of Scope or Listerine, but the divergence between the market cap weighted indexes which we commonly refer to and monitor, and the overall non-cap weighted market, which can be viewed by observing a chart of the NYSE composite. The Russell 2000 can also be considered in this context – while it is a small cap index, it is comprised of 2000 stocks and is not market cap weighted as are the S&P 500 and the Nasdaq. There is also an interesting current divergence between the overall Nasdaq composite and the Nasdaq 100 index which serves to prove the point about the market’s current bad breadth. So, let’s go to the charts:
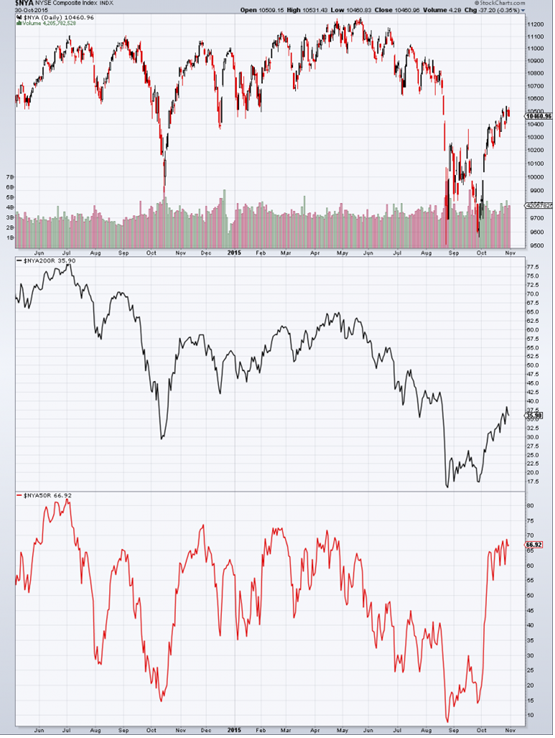
What are we looking at here? Let’s go in order from the first chart at the top and progress downwards.
The first chart shows two things: 1) While the cap weighted S&P and the Nasdaq composite are approaching the all time highs reached earlier this year, the non-cap weighted NYSE Composite index is not; so far, it is exhibiting a normal retracement of the losses incurred during the summer months, approximately an overall 50% Fibonacci retracement. A chart of the Russell 2000, not reproduced here, will look similar 2) Over the past few weeks, the percentage of stocks above their 200 day moving average has progressed from extremely oversold to what is usually considered merely an oversold level and has barely budged during the past 2 weeks. Currently, nearly 2/3 of all NYSE stocks are below their 200 dma, a status not usually associated with a healthy market
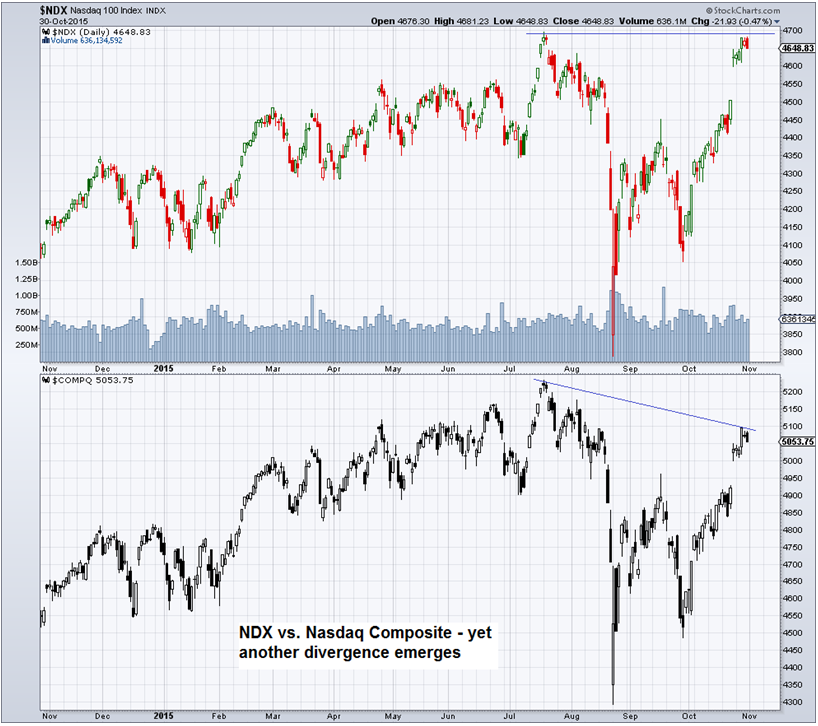
The second chart shows that, while the Nasdaq 100 (an index of the 100 largest non-financial Nasdaq stocks) has recently established a new high, the overall Nasdaq composite index has not; at least, not yet. This is the divergence mentioned previously in this text
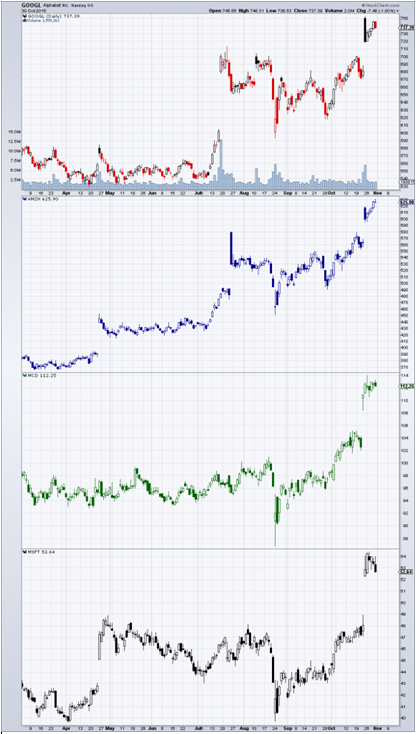
The third chart shows recent price action in a few well known large cap stocks that can heavily influence the market indexes to which they belong.
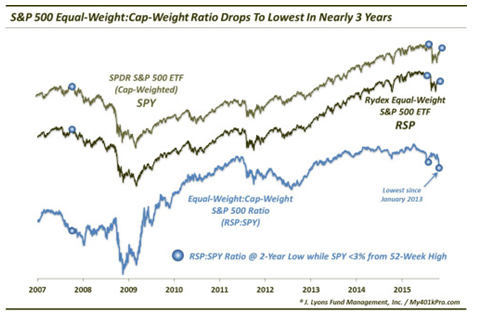
The fourth and last chart will show the ratio between RSP (an etf for an equal weighted S&P 500) and SPY (the etf proxy for the cap weighted S&P 500). The ratio of RSP:SPY is currently the lowest it has been in nearly 3 years. Historically, when this ratio is at a 2 year or more low while SPY is within 3% of a 52 week high, it has not boded well for SPY. This has only set up this way twice before, once in Sept. – Nov., 2007, and once in July, 2015, with obvious results as an aftermath.
Conclusions? The recent rally exhibited by the cap weighted market indexes is the result of feverish institutional buying of a relative handful of influential big cap stocks such as AMZN, GOOGL (or Alphabet), MCD, MSFT, and some others. While the overall broader market has rallied also, it has not done so to quite the same extent and is not approaching the all time highs of earlier this year quite as closely. A large number of stocks have not participated in this rally at all. In order for this rally to continue, more stocks are going to need to participate or the institutions are going to need to continue driving prices higher in these same bigger cap stocks. With equity valuations now higher than they were when the all time highs in the indexes were established earlier this year (this is due to declining earnings and sales across the overall market, resulting in higher valuations based on earnings and revenues), this will prove to be a tall order, indeed. Ms. Yellen may very well prove to be up to the task, though.
General Market Observation: The trading week will be split in half this week with the celebration of Veteran’s Day on Wednesday November 11th.
How healthy is the market and does this question even matter as long as prices on the indexes are going up? As we saw in Mike’s article today participation rate of stocks in this rally is not really healthy, but at the same time the indexes and the leaders continue to march higher. Let’s not argue with price action and just go with the current trend which is up. I’ve pointed out several times over the recent week’s that the Russell may provide the greatest potential if we moving into a solid Santa Claus rally. Both the S&P and NDX slowed in their move higher last week, but the RUT seemed to shift into another gear. Because of this positive action I will treat every pullback to the 8 day EMA on the RUT as a chance to buy either IWM or TNA. If TNA makes an assault on the highs of the year this will yield a return of about 30%. Will it make it? We shall see.
SPX is still working in the resistance zone up to the highs of the year. On Friday the NDX closed back above its breakout level of 4694. I will be sizing up moves in each and may entertain taking a 1/3 position in each on a positive entry trigger point.
_____________________________________________
The Early Warning Alert Service has hit all seven major market trading point this year. A new update video will be posted on this service the week of November 8th.
If simplifying your life by trading along with us using the index ETF is of interest you can get the full background video at: https://activetrendtrading.com/etf-early-warning-alerts-video/
The How to Make Money Trading Stock Show—Free Webinar every Friday at 10 a.m. PDT. This weekly live and recorded webinar helped traders find great stocks and ETF’s to trade with excellent timing and helped them stay out of the market during times of weakness.
The “How to Make Money Trading Stocks” Show Nov 13th
Register Here: https://attendee.gotowebinar.com/register/4019475132496560386
To get notifications of the newly recorded and posted How to Make Money Trading Stocks every week subscribe at the Market Tech Talk Channel: https://www.youtube.com/channel/UCLK-GdCSCGTo5IN2hvuDP0w
- The Active Trend Trader Referral Affiliate Program is ready. For more information or to become an Affiliate please register here: https://activetrendtrading.com/affiliates-sign-up-and-login/
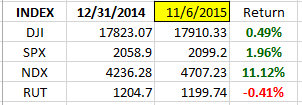
Index Returns YTD 2015
ATTS Returns for 2015 through Nov 6, 2015
24.0% Invested
Margin Account = +9.4% (Includes profit in open positions)
Early Warning Alerts = 10.2%
Active Trend Trading’s Yearly Objectives:
- Yearly Return of 40%
- 60% Winning Trades
- Early Warning Alert Target Yearly Return = 15% or better
For a complete view of specific trades closed visit the website at: https://activetrendtrading.com/current-positions/
Updated first full week of each month.
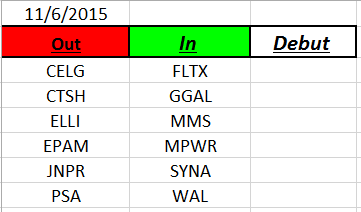
Outs & Ins: No new stocks made a debut on the IBD 50 this weekend. Only a handful of stocks on the list still have earnings to report with 4 reporting this week. NTES reports AMC on the 11th. NOAH reports on the 16th an
I will start doing my yearly analysis of the IBD 50. One thing I think we will find is that even with the haphazard nature of this year’s market the IBD 50 again delivered several stocks with high double digit moves during the year. One of the areas of focus through the rest of 2015 and into 2016 is how can we capture more of these winners and even build a solid portfolio using the Active Trend Trading System.
Comments and opinions written below this line of text may be provocative and only obliquely related to trading. Some may find these “Off the Wall” comments challenging to their outlook on life. I will not post any comments made on subject matter below this line, so if you disagree blast away.
OFF THE WALL
Off the Wall: Enjoy and value your freedom? Thank a Vet—We were willing to die for you!
Share Your Success: Many of you have sent me notes regarding the success you are having with the Active Trend Trading System. Please send your stories to me at dww@activetrendtrading.com or leave a post on the website. Thanks.

