February 25, 2018
Good Day Traders,
As prices push up close to the past highs will this move prove to be a continuation of the Bull Market or a potential Bull Trap. At this point it could be either. Stick to trading pullbacks into defined moving averages or support zones on the Indexes until the current uncertainty is over.
Mike’s Macro Market Musing this weekend shows why Warren Buffett is raising cash. Should we be doing the same? Excellent information.
Bounce Zones for Premium Members: If you are a premium member some very powerful conditional order setup information will soon be available to complement the “Go-No Go” Table each week. Chart showing zones where traders can expect prices to bounce due to supply and demand pressures. What does this mean for Premium members? Charts of our ETFs and Core Stocks with define Bounce Zones will empower you to place conditional orders around these areas for both entry and planned exits. This will be one more way Active Trend Trading will help Premium Traders with limit time for market analysis. Stay tuned for more on this beneficial feature!
Pre-Earning Runs: At my conference this week I learned a new trade mechanics for earnings that will exceed the great results we have doing during earning season. YY is up for earnings in a month. We’ll set up this new trade this week! These special opportunities come around every quarter. Kind of a bonus for Premium Members!
Mike’s Macro Market Musings: Uncle Warren’s Funhouse
Anyone even peripherally interested in trading and investing is likely aware of Warren Buffett. During the first few decades of his investing career, say from the 1950’s through the early 1990’s, he was able to operate under the radar since almost nobody knew who he was and what he was doing. And, anyone who bothers to read any of the stuff I write is likely aware that I have done a lot of reading about Warren Buffett and that I do mention him more than once in a while. I find him a fascinating character and there are valuable lessons to be learned from his personal history. Much has been written about him the past 20 years or so and he can no longer go about his business in relative obscurity, although he doesn’t seem to mind, at least not that he’ll publicly admit to. While in reality he is not what his carefully manicured public image would seem to suggest by the nickname of “Uncle Warren”, at the age of 87 he is still a financially savvy guy and he has become one of the wealthiest men on our planet due to his knowledge and skill in navigating the financial markets.
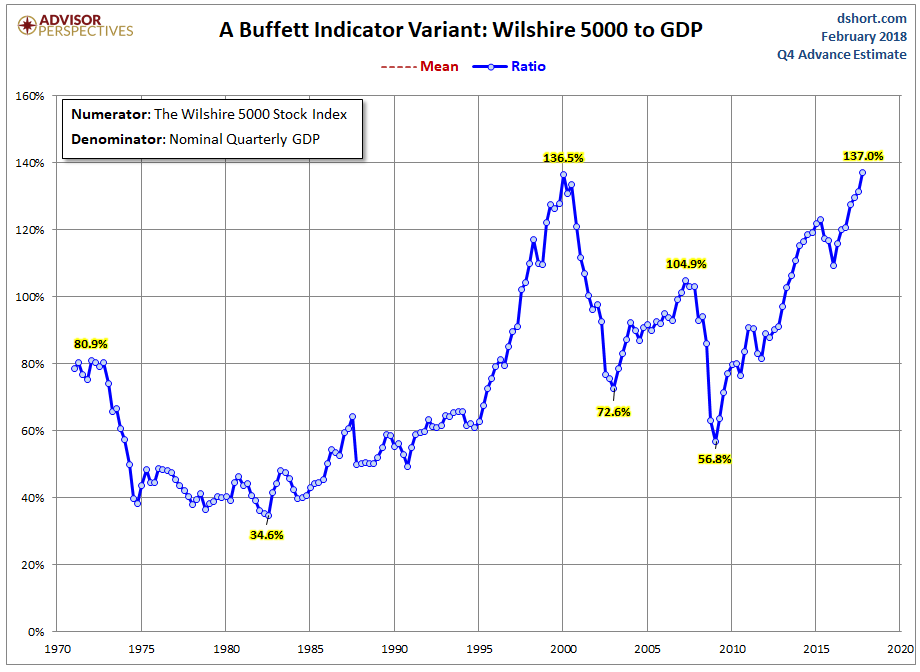
Back in 2001, during the period of the stock market “crash” that followed the dot com “boom” which had peaked in early 2000, Buffett indicated in an interview that his preferred indicator of where overall stock market valuations stood at any given time was the ratio of total stock market capitalization (as represented by the Wilshire 5000 index) to the overall gross national product, or gross domestic product (GDP), of the United States (GDP and GNP are slightly different numbers; GDP is the one most commonly referred to). This ratio has hence come to be informally known as the Buffett indicator or Buffett ratio. For those familiar with the fundamentals used to evaluate the financials of individual companies for investment purposes, this is basically a price to sales ratio for the U.S. markets relative to the overall economy. For purposes of this presentation, we will ignore the fact that the Wilshire 5000 index no longer is composed of 5000 stocks – 3,618 in all, as of Dec. 31, 2016. It was named for the nearly 5,000 stocks it contained at launch. It grew to a high count of 7,562 in 1998, and the last time it actually contained 5,000 or more companies was at the end of 2005.
Since I have been harping on overall market valuations for a while now, and since Dennis has mentioned that he recently attended some training sessions where stuff of this nature was discussed, let’s take a look at an update of what this indicator implies, keeping in mind that in his earlier years Uncle Warren was very much a value investor not willing to overpay for the stocks and companies in which he invested (although not currently as stringent in his value discipline as he once was):
According to this valuation metric, the Wilshire 5000 index is now the most expensive or overvalued it has ever been since it was first developed in the early 1970’s, even marginally more so than at the peak of the dot com boom in early 2000. Look at how far it has come from the trough at the market bottom in 2008 – 2009 – Uncle Warren’s funhouse, indeed. One can give thanks to our Federal Reserve Board and its loose monetary policies for all the fun that investing and trading has been the past several years.
I believe it reasonable to wonder what Uncle Warren might be doing with his investment portfolio given the current extremes in overall market valuations? Does he put his money where his mouth is, so to speak? The following are excerpts from some reading I’ve done just earlier today (2/24/18):
“Well, we received another update on Buffett’s long-term thinking on Friday when the Wall Street Journal reported that Berkshire Hathaway is holding more than $100 billion in cash or cash-equivalents – i.e. Treasury bills – on its balance sheet. It held $109 billion in cash as of Sept. 30, up from $86 billion at the end of 2016 and more than double what it had at the end of 2006. Nearly all of that was invested in short-term bills, according to Mr. Buffett. It held more bills around the end of the third quarter than large countries such as China and the U.K. It also had more at that time than the $13.5 billion held collectively by a group of 23 primary bond dealers that are obligated to underwrite U.S. government debt sales.”
“Could this really be Buffett hinting that, though he feels compelled to maintain his optimistic rhetoric in public, he’s in reality bracing for the next crash?”
Imagine that – Berkshire Hathaway (essentially Buffett’s investment fund) owns more short term U.S. Treasury debt than China!
While valuation metrics are admittedly of no use as timing indicators, they can be helpful for providing expectations of longer term equity market performance. I think that we can logically deduce from the above information that Uncle Warren, a traditionally value oriented investor, doesn’t seem to feel that current market valuations offer much potential for longer term investing returns and that he is keeping a very large amount of “powder” dry while waiting for more favorable valuations to deploy the enormous amount of cash he has available. I find it prudent to pay attention to what he does more so than what he says (actually, a compelling philosophy I actively employ in my personal life away from the financial markets). Although, he has been quoted as saying that “value is what you get, price is what you pay”. His large current cash position would seem to indicate that he doesn’t perceive much value at current U.S. equity market prices.
For those of you who might be interested in reading the source articles from which the above information has been pulled, here are the links:
http://viableopposition.blogspot.ca/2018/02/how-fairly-valued-is-stock-market.html
Remember to register for the After Market Monday and Making Money Trading Stocks and ETFs each week. In these webinars I will provide 10-12 stock set ups per year. All Levels of ATTS members will receive these trade email alerts. The NEW Composite Watch List provides a sort of all stocks that appeared on multiple Premium IBD Watch Lists this week. Often appearing on multiple list is a sign of strength and identifies a strong long term candidate. New Composite List Provided Below!
Register here to not miss the BONUS Trades or the ATTS Webinar Invitation list: https://forms.aweber.com/form/33/1084761733.htm
Running List, Strongest Fundamental stocks on the IBD 50 and the NEW Composite List of Stocks showing up on multiple IBD Watch List on Feb 23.
Running List: 93 stocks are on the 2018 Running list. Major swap out this week. Find the list here: Running 2-23
When the new IBD 50 list comes out twice per week I conduct a fundamental sort which results in the top fundamental IBD 50 stocks being identified. The top fundamental stocks for this week are: WB, GRUB, NOW, HTHT, NVDA & ABMD. This sort is provided at: 2-23 Sorted
A new addition to the weekly watch lists for Active Trend Traders is a Composite List of IPOs and Growth Stocks appearing on multiple IBD watch list each weekend. When a stock appears on multiple Premium Lists it can potentially be an indication of excellent strength. The stocks on the weekly Composite List may not be at a sound trigger point but may be worth watching for future entries. I will do an analysis of the list looking for price near potential triggers. Stocks near potential triggers will be highlighted. The top stocks appearing on more than one IBD watch list last week are shown in the table below. The Composite List for this week: Composite 2-25


