Februrary 18, 2018
Good Day Traders,
So what color are Yield Signs? Why is this an important question? Because it may illustrate a bias tendency we all have to believe what we think is true even though it may not be true. Our beliefs lead to actions and actions lead to results. If beliefs are erroneous then our results will be flawed and in some cases fatally flawed when it comes to Trading! By the way, a yield sign is red & white. Most people erroneously believe its yellow. Could erroneous beliefs be impacting your trading results?
I spent 3 days in a training class last week and had some of my beliefs challenged regarding longer term investments. We are approaching a very important point in trading history. The end of one of the longest bull markets. The longest one was around 10 years and the current Bull is at about 9 years. Are we beginning to see the topping patterns for the demise of this Bull? The ending of the Bull market will provide what may be one of the greatest investment opportunities in history. For some of us this may be our last chance to participate in one of these life-changing financial events. I project out that this wealth building opportunity will take place within the next 3-5 years. I’m going to prepare for this event by raising cash with income trades and be ready for the bottom! For perspective, if an investors would have invested $100K in MSFT at the low in 2009 when the last Bear Market ended that $100K would be worth over $600K today. In addition they would also collect a quarterly dividend of 0.42 on 6700 shares ($2814/QTR). The cost of MSFT shares in 2009 was $14.87 so the dividend by itself is over 11% on the cost basis as long as there is a MSFT. This type of opportunity takes place at the end of every Bear market–our objective be ready this time!
Mike’s Macro Market Musing this weekend provides a follow on to his last article on Reversion to the Mean. His topic this weekend is “A Trend Following System Variation”.
Bounce Zones for Premium Members: If you are a premium member some very powerful conditional order setup information will soon be available to complement the “Go-No Go” Table each week. Chart showing zones where traders can expect prices to bounce due to supply and demand pressures. What does this mean for Premium members? Charts of our ETFs and Core Stocks with define Bounce Zones will empower you to place conditional orders around these areas for both entry and planned exits. This will be one more way Active Trend Trading will help Premium Traders with limit time for market analysis. Stay tuned for more on this beneficial feature!
Pre-Earning Runs: At my conference this week I learned a new trade mechanics for earnings that will exceed the great results we have doing during earning season. YY is up for earnings in a month. We’ll set up this new trade this week! These special opportunities come around every quarter. Kind of a bonus for Premium Members!
Mike’s Macro Market Musings: A Trend Following System Variation
In very recent columns, I have presented a very simple and effective trend following strategy for the U.S. equity indexes, specifically the S&P 500 (SPX), based on the 10 month simple moving average on a monthly chart. I won’t bother reiterating that information since it can be easily referenced and has recently been updated to the current status as of the end of January, 2018. This methodology is intended for those who have limited trading activity capabilities in retirement accounts and/or those who just don’t want to be terribly active and don’t want to watch the market everyday. However, I do realize there are many of you out there who may not be quite so patient and would like to be more active. So, if that description applies to you, here you go.
The 10 month simple moving average (sma) on a monthly chart is roughly equivalent, although not exactly equal, to the 200 day simple moving average on a daily chart, since there are approximately 20 trading days in a calendar month. So let’s consider the possibilities of trading SPX around the 200 day sma on a daily chart. The methodology is quite simple. When price of SPX has been below the 200 day sma and then proceeds to cross and close above the 200 day sma, you would go long by buying SPY (the SPX etf) or one of the SPX based derivatives such as UPRO (the 3x leveraged etf for SPX) or a mutual fund, and then stay in that position until the price of SPX closes below the 200 day sma, at which time you would exit the position and keep the proceeds available until the next entry signal occurs. This is a long only methodology – we are not shorting when price closes below the 200 dma.
The following charts and graphs will depict the effectiveness of this methodology in a backtest going back to January, 2000. Keep in mind that the results are for SPY, the non-leveraged SPX etf. The leveraged index etfs have only been available since 2009. Going forward, the use of leverage will significantly amplify the results, in both directions.
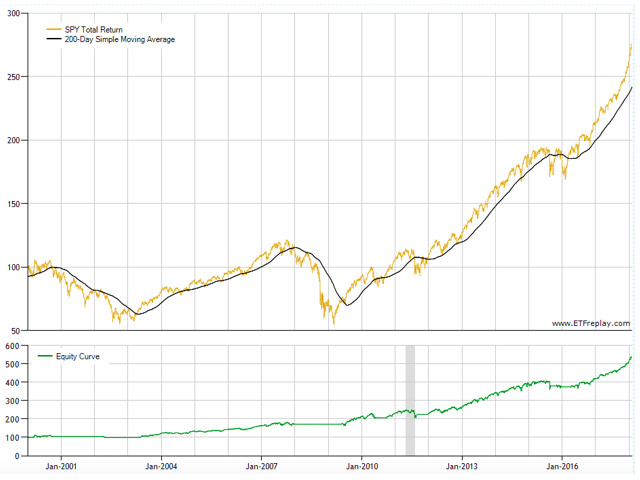 The equity curve graph above illustrates that, utilizing these signals and this methodology, a hypothetical $10,000 account invested in January, 2000, and traded according to the above rules, would have grown to approximately $52,000 as of early 2018. For comparison, buying and holding SPY from January, 2000, through early 2018 would have resulted int the initial hypothetical $10,000 growing to roughly $28,000, as illustrated by the following backtest statistics:
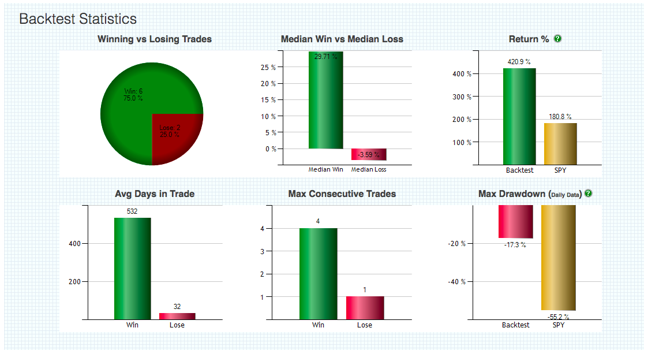
Keep in mind while reviewing all of this that there were two very significant bear markets during the period of this backtest, in 2000 – 2002 and 2007 – 2009. The effectiveness of this strategy comes from keeping one out of the market and limiting the damage during severe market declines when SPX price action spends prolonged periods of time below the 200 dma, and allowing one to participate in, and benefit from, much of the uptrends that the equity indexes frequently exhibit. The most recent signal to go long produced by this strategy occurred on 6/28/2016 (I am writing this on 2/12/2018), more than 18 months ago. Despite the recent turbulence in the markets in early February of 2018, SPX has not closed below its 200 day sma since then. On 6/28/16, SPX closed at 2036; it recently peaked at 2873 and, as of today, is still at 2656. I’ll leave it to the reader to work out the math.
As with any true trend following system, there will be periods of whipsaw when price action oscillates around the 200 dma. However, given the potential long term compounded results with this strategy as illustrated above, I don’t believe the potential for whipsaw should keep one from seriously considering the merits of this methodology. For those of you so inclined, I’d recommend further backtesting in order to gain the confidence to employ this strategy going forward since it seems to be quite worthy of consideration.
Remember to register for the After Market Monday and Making Money Trading Stocks and ETFs each week. In these webinars I will provide 10-12 stock set ups per year. All Levels of ATTS members will receive these trade email alerts. The NEW Composite Watch List provides a sort of all stocks that appeared on multiple Premium IBD Watch Lists this week. Often appearing on multiple list is a sign of strength and identifies a strong long term candidate. New Composite List Provided Below!
Register here to not miss the BONUS Trades or the ATTS Webinar Invitation list: https://forms.aweber.com/form/33/1084761733.htm
Running List, Strongest Fundamental stocks on the IBD 50 and the NEW Composite List of Stocks showing up on multiple IBD Watch List on Feb 10.
Running List: 89 stocks are on the 2018 Running list. Major swap out this week. Find the list here: Running 2-18
When the new IBD 50 list comes out twice per week I conduct a fundamental sort which results in the top fundamental IBD 50 stocks being identified. The top fundamental stocks for this week are: ANET, GRUB, HTHT & ABMD. This sort is provided at: 2-18 Sorted
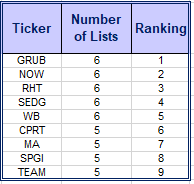
A new addition to the weekly watch lists for Active Trend Traders is a Composite List of IPOs and Growth Stocks appearing on multiple IBD watchlist each weekend. When a stock appears on multiple Premium Lists it can potentially be an indication of excellent strength. The stocks on the weekly Composite List may not be at a sound trigger point but may be worth watching for future entries. I will do an analysis of the list looking for price near potential triggers. Stocks near potential triggers will be highlighted. The top stocks appearing on more than one IBD watch list last week are shown in the table below. The Composite List for this week: Composite 2-18