April 16, 2018
Good Day Traders,
Over the last few weeks the Market has provided wide daily moves that has generate little traction in either direction. This range bound price action provides excellent short term trading opportunities but little in the way of portfolio building. The current price action is not a surprise given the strength shown in 2017. Currently, the Tracking Indexes are hardwired to selling off at resistance with buyers stepping in at support. Until this changes look for more of the same. Buy Support/Demand Bounces & Sell At Resistance/Supply Zones.
So where are we in the current market cycle? The chart below may provide a clue as to where the market is with respect to the cycle.
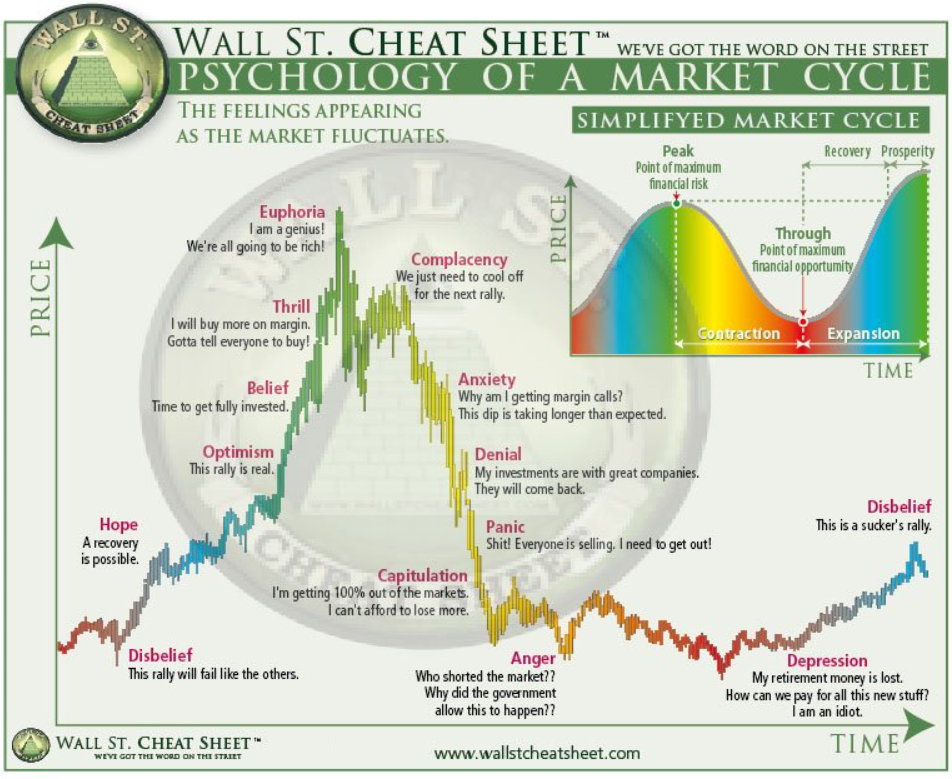
I found this chart this weekend and it is worth studying and then comparing it with a current weekly chart of the Indexes. Note the Simplified Market Cycle inset chart. If prices are currently close to the cycle peak then this represents the place of Maximum Financial Risk. Additionally, the place of Maximum Financial Opportunity coincides with emotional states of Disbelief, Anger and Depression. So where do you think we are in the current market environment?
Bounce Zones for Premium Members: If you are a premium member some very powerful conditional order setup information will soon be available to complement the “Go-No Go” Table each week. Chart showing zones where traders can expect prices to bounce due to supply and demand pressures. What does this mean for Premium members? Charts of our ETFs and Core Stocks with define Bounce Zones will empower you to place conditional orders around these areas for both entry and planned exits. This will be one more way Active Trend Trading will help Premium Traders with limit time for market analysis. Stay tuned for more on this beneficial feature!
With the Indexes showing weakness look for stocks that are holding up more strongly than the Indexes. Here’s a handful to watch: PAGS, WB, LGIH, RHT, COUP, TAL, GRUB, FANG and VNOM.
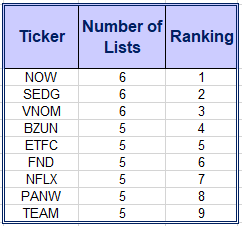
Remember to register for the After Market Monday and Making Money Trading Stocks and ETFs each week. In these webinars I will provide 10-12 stock set ups per year. All Levels of ATTS members will receive these trade email alerts. The NEW Composite Watch List provides a sort of all stocks that appeared on multiple Premium IBD Watch Lists this week. Often appearing on multiple list is a sign of strength and identifies a strong long term candidate. New Composite List Provided Below!
Register here to not miss the BONUS Trades or the ATTS Webinar Invitation list: https://forms.aweber.com/form/33/1084761733.htm
Running List, Strongest Fundamental stocks on the IBD 50 and the NEW Composite List of Stocks showing up on multiple IBD Watch List on April 1st.
Running List: 110 stocks are on the 2018 Running list. Major swap out this week. Find the list here: Running 4-14
When the new IBD 50 list comes out twice per week I conduct a fundamental sort which results in the top fundamental IBD 50 stocks being identified. The top fundamental stocks for this week are: WB, LGIH, GRUB, NOW, FND, ABMD, CPRT & PAYC. This sort is provided at: 4-14 Sorted
A new addition to the weekly watch lists for Active Trend Traders is a Composite List of IPOs and Growth Stocks appearing on multiple IBD watch list each weekend. When a stock appears on multiple Premium Lists it can potentially be an indication of excellent strength. The stocks on the weekly Composite List may not be at a sound trigger point but may be worth watching for future entries. I will do an analysis of the list looking for price near potential triggers. Stocks near potential triggers will be highlighted. The top stocks appearing on more than one IBD watch list last week are shown in the table below. The Composite List for this week: Composite 4-14