Good Day Traders,
Overview & Highlights: The first two weeks in January 2016 have been the worst two opening weeks in Stock Market History. I am very pleased that the Active Trend Trading System and Early Warning Alert System assured that no fatal trading mistakes were made that would put us dramatically behind the power curve to begin the year.
Several have asked what changes we will make to either of the systems with the markets appearing to be moving quickly towards Bear territory. The answer to this is very little other than to shift our focus into stocks and ETF’s that will favor a downside market. The triggers for downside trades are very similar to the ATTS triggers to the upside. Each require patience for the set-ups. For the EWA system we are currently completing back testing on using the Inverse Index ETF’s. Remember that this system was designed to trade the major bounces from significant swing lows. In 2008, the last Bear Market, the EWA generated 5 trading signals with 4 of them leading to a profitable trades. The largest run in 2008 came in November. Each of the 3 Tracking Indexes moved up from the low over 20% by the end of the year. Will the Indexes behave exactly the same this year? Probably not but multiple double digit bounces tend to happen even in Bear Market.
Our object stay vigilant and diligent in waiting for the bounces. If the back testing is positive and not too complex we will add a downside trading capability to the EWA service. The challenge in the back testing for downside trades is that the proprietary indicators we use for upside trades are not as reliable for trading the downside. We will only add the downside when we have the same level of certainty we have for upside trades. Protecting both our capital and our member’s capital is very important to us.
2015 EWA Review video at: https://activetrendtrading.com/2015-early-warning-alert-system-performance-review-video/
Webinars: At Active Trend Trading we offer two webinars per week to provide training plus trade and market updates. See the schedule below for the next webinars.
How to Make Money Trading Stocks on Friday, Jan 22nd
Register Here: https://attendee.gotowebinar.com/register/94292290163777538
Next Training Webinar: Jan 19th
For Premium Members our Wednesday evening training is developing some fantastic traders!
Mid-Week Market Sanity Check Topic: Dynamic Compound Effect
General Market Observation: One of my primary take aways from reviewing several market websites like Yahoo Finance, Barons, IBD and others is the “Why” question posed by many of the financial writers this weekend. Why is the market imploding? Is it China? Is it Oil? Is it the Slowing Global Economies? Is it a combination of everything? As a technical trader we really do not have to spend much time speculating on the “Why”. We focus on what is going on with current price action and trade the probabilities of what may happen based on the history of what happened in similar situations previously. Does the why really matter? The purest Technical Analyst would say, “No not really.” We must be aware of what is happening.
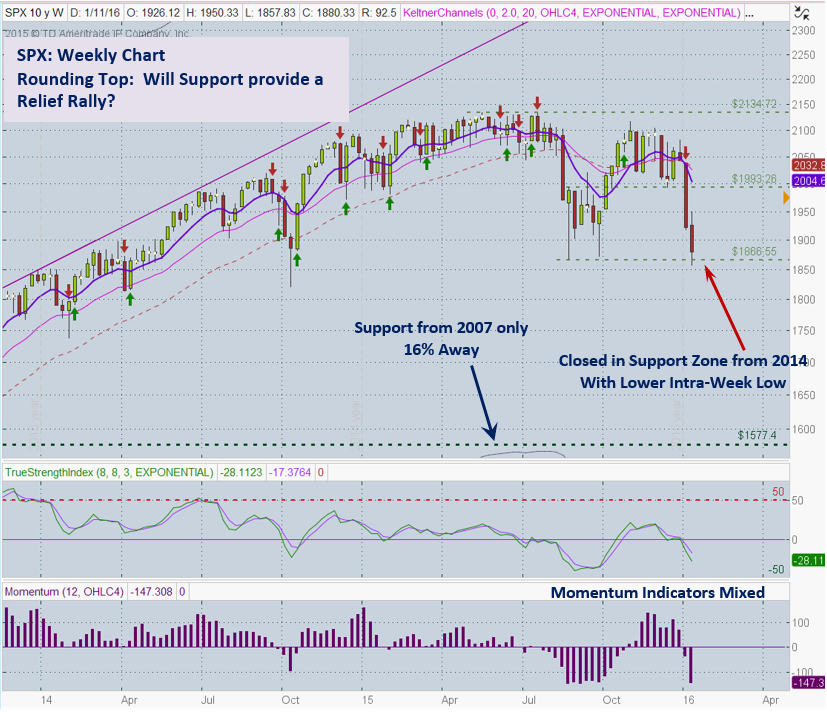
Each of the Tracking Indexes finished down for the second week in 2016. The first two weeks of 2016 represent the worst market decline in history. Prices are oversold and over extended and it would seem that a Relief Rally is due, but markets can continue to become more oversold and more extended before hitting a support level from which to bounce. The market attempted to rally twice last week with both attempts being choked off by sellers not ready to relax their grip on the dying Bull. Each of the Indexes continues to work on the right side of what appears to be a major slow rounding top. Slow rounding tops tend to be a precursors to major market drops. Now is a great time for all traders to draw in support lines that correspond to corrections from 2015 highs of -20%, -30% and more. Also Fibonacci Retracements drawn on Weekly and Monthly Charts from the lows in 2009 to the highs in 2015 may reveal hidden levels of major support.
While the path of least resistance is currently down, a downside set up is needed to trade any of the Index ETF’s or Inverse ETF’s. A valid entry would present itself if prices retraced to either the downward sloping 8 day or 8 week EMA. Secondary downside entry points may appear if price retraces approximately 50% into last week’s bearish candle and starts to stall. On the SPX this would be at 1900.
A countertrend trade could be considered for a reversion to the mean trade if price action finds support and the distance back to the 8, 20 or 50 day EMA’s is large enough to warrant at least a 3-5% move on the Indexes. My pecking order for the Indexes from strongest to weakest is NDX, SPX and RUT.

SPX: Downside Market Short the SPY, SPY Puts or SPXU. Preferred ETF’s: SPY, UPRO and SPXL
NDX: Downside Market Short the QQQ, QQQ Puts or SQQQ. Preferred ETF’s: QQQ and TQQQ
RUT: Downside Market Short the IWM, IWM Puts or TZA. Preferred ETF’s: IWM and TNA
The How to Make Money Trading Stock Show—Free Webinar every Friday at 10 a.m. PDT. This weekly live and recorded webinar helped traders find great stocks and ETF’s to trade with excellent timing and helped them stay out of the market during times of weakness.
How to Make Money Trading Stocks on Friday, Jan 22nd
Register Here: https://attendee.gotowebinar.com/register/94292290163777538
To get notifications of the newly recorded and posted How to Make Money Trading Stocks every week subscribe at the Market Tech Talk Channel: https://www.youtube.com/channel/UCLK-GdCSCGTo5IN2hvuDP0w
The Active Trend Trader Referral Affiliate Program is ready. For more information or to become an Affiliate please register here: https://activetrendtrading.com/affiliates-sign-up-and-login/
Index Returns YTD 2016
I’ve added a column to the Index YTD performance chart. The column on the far right shows the depth of the current correction with respect to the highs of the top from 2015. Currently RUT is in Bear Market Territory. Also be aware that the Nasdaq Comp is currently 14% down from its 2015 top.
ATTS Returns for 2016 through Jan 15, 2016
Percent invested $100K account: Strategies I & II invested at 0%; Strategy III invested at 20%.
Current Strategy Performance YTD (Closed Trades)
Strategy I: Down -407.85 or -0.58%
Strategy II: 0%
Strategy III: Up $757 or +3.77%
Active Trend Trading’s Yearly Objectives:
- Yearly Return of 40%
- 60% Winning Trades
- Early Warning Alert Target Yearly Return = 15% or better
For our all Active Trend Trading Members here’s how we utilize our trading capital
Trading Capital Setup and Position Sizing: Every year we start the year off trading a $100K margin account split up into the three strategies used with the Active Trend Trading System.
- Each trader must define their own trading capital in order to properly size trade positions to meet their own risk tolerance level
- Strategy I: Capital Growth—70% of capital which equates to $140K at full margin. This strategy trades IBD Quality Growth Stocks and Index ETFs. Growth Target 40% per year.
- Strategy II: Short Term Income or Cash Flow—10% of capital or $10K. This strategy focuses on trading options on stocks and ETF’s identified in Strategy I. The $10K will be divided into $2K units per trade.
- Strategy III: Combination of Growth and Income—20% of capital or $20K. This strategy will use LEAPS options as a foundation to sell weekly option positions with the intent of covering cost of long LEAPS plus growth and income.
- The $70K Strategy I portion of the trade account is split between up to 4 stocks and potentially a leveraged Index ETF. Actual number of shares will vary of course depending on price of the entity traded and amount of margin available. We have found that limiting open positions to only 5 entities greatly reduces the trade management time requirements for members.
- Naked Puts or short term options strategies will be used occasionally for Income Generating Positions
- None of the trade setups are recommendations to trade only notification of planned trades from set ups using the Active Trend Trading System. Each trader is responsible for establishing their own appropriate risk level if they decide to parallel trade.
- The Active Trend Trading System objective is to provide a clear and simple system designed for members who work full time.
For a complete view of specific trades closed visit the website at: https://activetrendtrading.com/current-positions/
Updated first full week of each month.
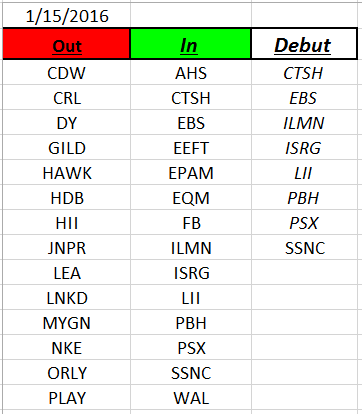
Outs & Ins: Another big purge on the IBD 50 last week. In the first two weeks of 2016 84% of the stocks that began the year on the IBD 50 list have been replaced. The Running List is up to 92 stocks. For those who saw the presentation about the IBD 50 at the recent BAMM meeting remember that this elite IBD list does two things. Provide great growth candidates when the market is in an uptrend and also provide great shorting candidates when the market is correcting. Overall the current IBD 50 is reflecting the market weakness with only 10 stocks closing above their 50 day EMA. Of the stocks debuting this weekend only ISRG is above the 50 day. The other look to be basing below their 50 day.
Of the stocks holding above the 50 day EMA ELLI provides the best consolidation pattern.
Share Your Success: Many of you have sent me notes regarding the success you are having with the Active Trend Trading System. Please send your stories to me at dww@activetrendtrading.com or leave a post on the website. Thanks.


