Good Day Traders,
What a great week! I attended a great training early in the week that enables me to better understand the strength and weakness of the internals on stocks and Indexes. This will benefit our members because it will providing one more very powerful convergence of clues on the potential of a trade moving higher or failing!
We launched our new Early Warning Alerts to trade Index ETF (leveraged & non-leveraged) using Trager’s Triggers. I want to thank all those who checked this out decided to be early adopters. If you have not had a chance to check out the research Mike Trager and I have done to start the EWA service you can find a short 10 minute preview at: http://youtu.be/MgC9GMAWh4w
Or if simplifying your life by trading along with us on the index ETF is of interest you can get the full background video at: https://activetrendtrading.com/etf-early-warning-alerts-video/
Lastly the best thing that happened this week was Thanksgiving and watching my granddaughter ride on my 63 year old rocking horse carrying on a family tradition through the 3rd generation. This important family event was followed up with wonderful dinner with family and friends up in Navato. Lot’s to be thankful for including a growing family of Active Trend Traders!
The “How to Make Money Trading Stocks” midday show is back on this Friday and to get hooked up register here: https://attendee.gotowebinar.com/register/3922493801293464578
To get notifications of the newly recorded and posted Market Stock Talk every week subscribe at the Market Tech Talk Channel: https://www.youtube.com/channel/UCLK-GdCSCGTo5IN2hvuDP0w
If it’s the beginning of the month it is time for another installation of Mike Trager’s Monthly Market Musings. This week’s topic is very timely as the market appears to be primed for some mean reversion. Good Stuff!
Mike’s Monthly Market Musings: Yin, Yang, and Mean Reversion
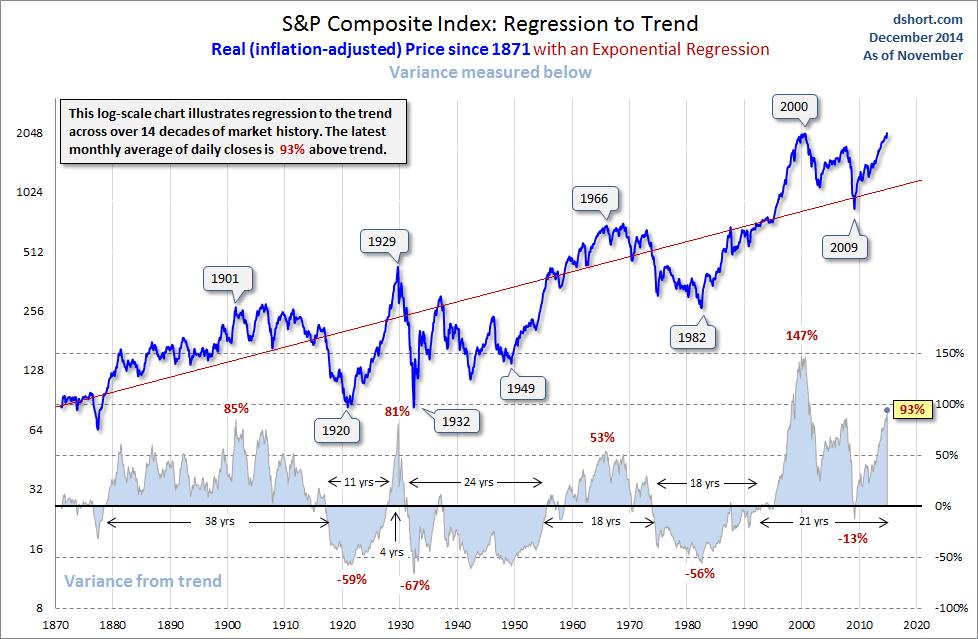
In physics, one of the Newtonian laws is that for every action there is an equal and opposite reaction. In the financial markets, this phenomenon is referred to as “reversion to the mean”. Market history over a number of centuries illustrates that when markets reach extremes either to the upside or downside they will eventually not only revert to some type of mean or average, but they have a tendency to overshoot past whatever that mean happens to be, as the following chart illustrates.
 As a side bar, notice that the S&P market bottom in March, 2009, represents a mere regression to a multi-decade regression trendline mean from an extreme overshoot to the upside represented by the market peak in 2000 preceding the dot.com bust. Also notice how far above the regression trendline current market price levels are in relation to prior historical peaks, and how price always eventually reverts back to this trendline regardless of how extremely it overshoots
In the context of the U.S. equity markets, and in conjunction with the above chart, consider some of the following factoids gleaned from the observation by various sources of over a century of price action:
1. A common Wall Street rule of thumb adage is that bull markets tend to last about 3 times longer than bear markets and that bear markets take back about 50% of the gains of the preceding bull market
2. William O’Neil, founder of IBD, has stated that bull markets tend to last about 3 1/2 years and bear markets last about 1 year, on average
3. In an IBD article November 10, 2014, the point is made that since 1921 bull markets last longer than bear markets and gain more than bear markets lose. In fact, since 1921, the average bull market lasts 49 months and gains 153% and the average bear market lasts 17 months and loses 38.3%. Note how closely this adheres to the above rule of thumb duration ratios and rule of thumb bear market reversions. I will reserve comment on using 1921 as the starting point for this time period observation. Suffice to say it skews things to the bullish side somewhat.
4. Here’s a quote copied from some reading over the past several days: “Valuations are going to revert to the mean. They always do. And when they do, they’ll overshoot in the process. The business cycle still exists.”
Putting all of this into a current perspective, consider the following arithmetical realities:
1. Using SPX as the measurement vehicle, the current bull market is deemed by many to have started off of the March, 2009, lows and is therefore now 68-69 months old, far exceeding the 49 month average noted above. There has not been a bear market in SPX (technically defined as a 20% or greater correction) during that time.
2. The trough to peak price move in SPX during this most recent bull market now exceeds 200%, or approximately 33% more than the average price appreciation in a bull market run. Other indices such as the Russell 2000 and the Nasdaq composite have experienced far more than 200% price appreciation during this time, with the Nasdaq move approaching 300%.
If we can assume a market top has been established (by no means a safe assumption, we’re just having a friendly hypothetical discussion here), and if history tends to repeat, or at least rhyme with, itself, and if we accept the concept and laws of mean reversion, then what might we reasonably expect in the intermediate to longer term future for SPX price performance?
Using round numbers for easy approximations and some of the information presented above, a 35% – 40% SPX correction to the 1200-1300 price area of SPX over a period of perhaps 20 months or so, doing nothing more than putting in a higher low on a multi-decade monthly or yearly chart and a mean reversion approximating the regression trendline in the above chart, should surprise absolutely no one except those who are unaware of all of the above information, which happily now no longer applies to you since you hopefully have a more informed perspective.
This concept of mean reversion can also be applied to shorter term trading strategies and actually forms the core of my trading philosophy and trade set ups, but more about that next time.
General Market Observation: I will keep the market comments short in this report. It appears that the Russell is in the process of uncoupling from the other two Indexes. For the whole year Russell has provided some excellent tradable rallies but has gained less than 1% since the closed on 12/31/13. It has led the way down on all pullbacks this year in front of both the SPX & NDX. We will see if Friday’s action in a shortened trading session is the precursor for another drop moving into December.
SPX: The S&P finished with a bearish Dark Cloud formation Friday and a small Shooting Star on the Weekly chart. Has price action reached the top? We have been asking this question several times over the past few weeks and time and again the price action has pushed higher. We know a pullback will happen, we just don’t know when.
Nasdaq 100: NDX pushed higher on Friday with no signs of weakness. This Index is the leader currently and being held up by a few power stocks like AAPL. Since this is a weighted index if the stocks with the heaviest weighting hold up while the laggards are falling it provides a sense of safety when in reality the foundation of the index is eroding. We’ll check early next week after a full day’s trading to see exactly how many stocks are actually participating in keeping this index on its winning ways.
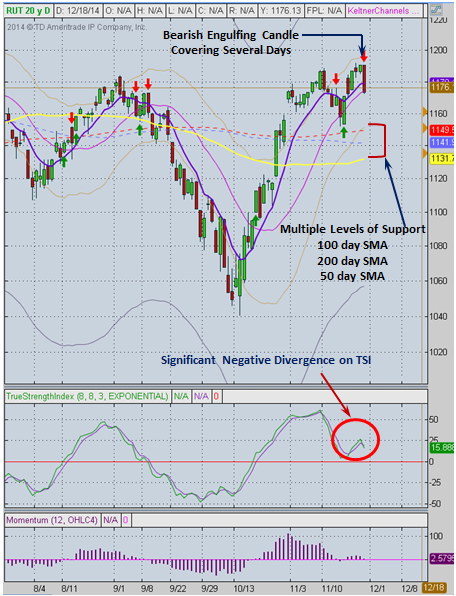
Russell: As highlighted in the opening the RUT seems to be most susceptible to a fall. Friday’s selloff gained momentum into the close and has now closed below both the 8 & 20 day moving averages. On a daily chart Friday’s price action resulted in a bearish Engulfing Pattern a strong reversal signal. This is like an outside day for non-candlestick folks. On a weekly chart we have a very clear bearish Shooting Star at resistance. If this signal is confirmed more downside could take place over the next few week. It’s time to draw in some a Fibonacci Retracement and see exactly how low price may go. A 50% retracement of the move that started on Oct 15th would hit the 1116 level. This is in the middle of a support zone. Hmmmm…..
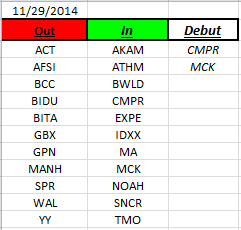
Outs & Ins: Two stocks brand new stocks make their debut on the IBD 50 this weekend. I use the IBD 50 as a gauge of market stability. When a significant number of stocks flip in and out of the list this is not a regular occurrence. This weekend eleven stocks trade places. Combine this with some increased selling on Black Friday and I stand back and just wonder if at least a pullback is coming?
CMPR is a recent IPO with no IPO pattern yet. MCK just broke above the 207 level so it’s not ready to enter.
Comments and opinions written below this line of text may be provocative and only obliquely related to trading. Some may find these “Off the Wall” comments challenging to their outlook on life. I will not post any comments made on subject matter below this line, so if you disagree blast away.
OFF THE WALL

Off the Wall: I listened to a good message today. It said everyone should be quick to listen, slow to speak and even slower to become angry. With all the noise over the past few weeks it seems that everyone wants to speak and say something but few really take the time to listen. Often we hear rhetoric that has little value because it takes limited critical thought to just parrot back a few talking points in front of a camera or on a social media post. Hey, I’m guilty of that on my Facebook page. See something I agree with and just reposted it and add to the noise that’s out there.
I got to thinking that I need to listen better. I’m always in such a hurry to speak especially if I’m defending myself from what I think is an attack on my beliefs. In reality when I blab out trying to get my point across it falls on deaf ears. Deaf ears are a two way street though and it seems that in modern society both parties in a conversation have them. We talk and no one listens and when they talk we don’t listen.
Might be a good idea to listen long enough to see if what’s being said is worth listening to, or at least ask the question, “Help me understand what you are trying to say.” If it turns out to be rhetoric BS, at least we’ll know its rhetoric BS and maybe talking back to that person may be just a waste of time….Hmmm….that would leave more time to look at stock charts!
Share Your Success: Many of you have sent me notes regarding the success you are having with the Active Trend Trading System. Please send your stories to me at dww@activetrendtrading.com or leave a post on the website. Thanks!


