
Good Day Traders,
Overview & Highlights: Momentum appears to be waning on the Indexes. Will this lead to a quick pullback or more? We shall see.
I hope all members have seen some of the live Facebook broadcast. If you want notification of when these live market updates take place, please follow Active Trend Trading at: https://www.facebook.com/ActiveTrendTrading/
Upcoming Webinars: At Active Trend Trading we offer three webinars per week to provide training plus trade and market updates. See the schedule below for the next webinars.
The How to Make Money Trading Stock Show—Free Webinar every Friday at 11:00 a.m. PDT. This weekly live and recorded webinar helped traders find great stocks and ETF’s to trade with excellent timing and helped them stay out of the market during times of weakness.
How to Make Money Trading Stocks on Friday, March 10th
Register now for the next live webinar at the link below:
Register Here: https://attendee.gotowebinar.com/register/385843200414302723
Time 11:00 a.m. PDT
Next Training Webinar: March 8th
For Premium Members, our Wednesday evening training is developing some fantastic traders
Topic: Early Warning Updates
** Friday’s “Final Hour”: March 10th **
Time 12:00 p.m. PDT
For Premium Members, provides trades and set ups during the final hour of weekly trading.
General Market Observation: How strong will the current pullback be? The last thrust on all three of the Tracking Indexes broke out to new highs. What next? Recognize the uptrend is still intact so until they stop working look for a trade coming out of the pullback. My focus will be on the Russell, but if SPX or NDX rebounds more quickly the leveraged ETFs for these indexes may be the trade. The probabilities are in favor of a positive year for the Indexes due to both January and February being positive. Going back to 1950, 24 out of 26 years provided positive yearly results when the first two months of the year were up. This conflicts with the expectations of a Post-Election year seasonality, but this past election was far from our average election. Could it be true that there is a bound-up momentum which could be unleashed because of lower taxes and fewer regulations? We shall see!
The SPX chart below shows a ceiling at 2400 and a floor at the 2354 level. Today’s close below the 8 day EMA increases the probability that the 20 day EMA or 2354 being tested. March tends to be an up month so a pullback into a buy zone may take place and then a sideways move until the October/November timeframe. In my study of the small cap stocks, many catch a bid in March through April. This may be partly due to funds entering retirement accounts to beat tax season restrictions. Regardless the reason, I’ll be watching the levels identified for potential trade entries on the UPRO, TQQQ or TNA.
NDX showing a personality like the SPX. If the current pullback results in a bounce, the health of the current uptrend will be revealed by the character and strength of the bounce. If the bounce is weak and fails to move back up and through resistance, then a temporary top may be in place. This could lead to either a more significant pullback or a range bound sideways trend. A hiccup in tax reform and other legislation resulting in pushing these actions into 2018 the Indexes could react violently. The other unknown is rate hikes. Too fast and the rally will react negatively.
The Russell is rapidly approaching support at the 50 day EMA. The 50 has held over the past 4 months. If it fails at this there is support between the 1340 and 1350 levels. Both TSI & Momentum has fallen below the “zero” line on the daily chart. Both oscillators are pointed down and accelerating. The RUT often leads the other indexes and can be more volatile. It is currently the weakest Index. If the 50 day fails, look for support at the support zone highlighted above.

SPX: Downside Market Short the SPY, SPY Puts or SPXU.
Preferred Long ETF’s: SPY, UPRO and SPXL
NDX: Downside Market Short the QQQ, QQQ Puts or SQQQ.
Preferred Long ETF’s: QQQ and TQQQ
RUT: Downside Market Short the IWM, IWM Puts or TZA.
Preferred Long ETF’s: IWM and TNA
The How to Make Money Trading Stock Show—Free Webinar every Friday at 11:00 a.m. PDT. This weekly live and recorded webinar helped traders find great stocks and ETF’s to trade with excellent timing and helped them stay out of the market during times of weakness.
How to Make Money Trading Stocks on Friday, March 10th
Register now for the next live webinar at the link below:
Register Here: https://attendee.gotowebinar.com/register/385843200414302723
Time 11:00 a.m. PDT
To get notifications of the newly recorded and posted How to Make Money Trading Stocks every week subscribe at the Market Tech Talk Channel: https://www.youtube.com/c/MarketTechTalk
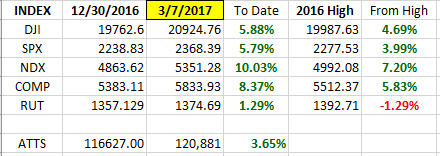
Index Returns 2017 YTD
ATTS Returns for 2017 YTD Closed Trades
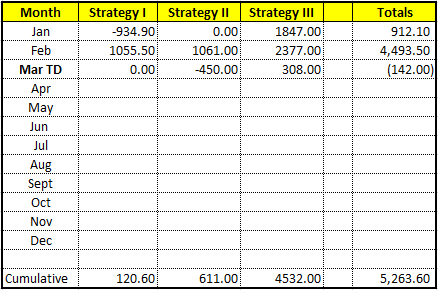
Percent invested initial $116.6K account: Strategies I & II invested at 23%; Strategy III invested at 26.6%.
Current Strategy Performance YTD (Closed Trades)
Strategy I: Up $120.60
Strategy II: Up $611.00
Strategy III: Up $4532.00
Cumulative YTD: 4.5%
Active Trend Trading’s Yearly Objectives:
– Yearly Return of 40%
– 60% Winning Trades
– Early Warning Alert Target Yearly Return = 15% or better
For a complete view of specific trades closed visit the website at: https://activetrendtrading.com/current-positions/
Updated first full week of each month. The next update after first week in March.
Outs & Ins: MDP is the only stock added to the IBD 50 mid-week. Meredith Corp finished out of the running for the best fundamental stocks after completing the sort on Fundamentals. In fact, only 2 stocks made it through the full sort. These are AMAT and ESNT. Dropping down one level below the top fundamental stocks brings NVDA, BEAT, NTES, CGNX, ANET and AEIS up for consideration.
About 70% of stocks move in synch with the Indexes. If the Indexes pullback and weaken then expect stocks on the IBD 50 to also pullback. This corresponds closely to historic seasonality where growth stocks move down during February or March and then start to rebound in April. This does not have to happen but does happen most years.

Share Your Success: Many of you have sent me notes regarding the success you are having with the Active Trend Trading System. Please send your stories to me at dww@activetrendtrading.com or leave a post on the website. Thanks.