Good Day Traders,
Overview & Highlights: I’ll be back to the office later this week, but will continue to monitor the market from the road through Wednesday. There was no “On the Radar” Report this weekend because there were no immediate set-ups. On the Radar, will only come out when there are solid potential entries shaping up.
Upcoming Webinars: At Active Trend Trading we offer two webinars per week to provide training plus trade and market updates. See the schedule below for the next webinars.
The How to Make Money Trading Stock Show—Free Webinar every Friday at 11:00 a.m. PDT. This weekly live webinar helped traders find great stocks and ETF’s to trade with excellent timing and helped them stay out of the market during times of weakness. With guest from around the world you get a great Global perspective.
How to Make Money Trading Stocks on Friday, Feb 10th
Register now for the next live webinar at the link below:
Register Here: https://attendee.gotowebinar.com/register/7562489734728631809
Time 11:00 a.m. PDT
Next Training Webinar: Feb 15th
For Premium Members, our Wednesday evening training is developing some fantastic traders
Topic: Conditional Orders and Target Shooting Entries
** Friday’s “Final Hour”: Feb 10th **
Time 12:00 p.m. PDT
For Premium Members, provides trades and set ups during the final hour of weekly trading.
Managing Current Trades:
Strategy I Portfolio Building: Long IDCC at 92.30 on 1/25
Stop at 5% or close below 8 day EMA
Profit Target T1 = 7%
Profit Target T2 = 15%-20%
General Market Observation: Will the Post-Election historical weakness show up this week? Since the election, the 3 Tracking Indexes has followed along historical norms and if this continues a healthy pullback should begin soon. This doesn’t mean the market is going to crash because at this point the catalyst for a major failure are not totally in place. However, a pullback lasting through the end of March would tell us that Indexes are following the historical price action and provide healthy long opportunities about 6-8 weeks from now. We shall see.
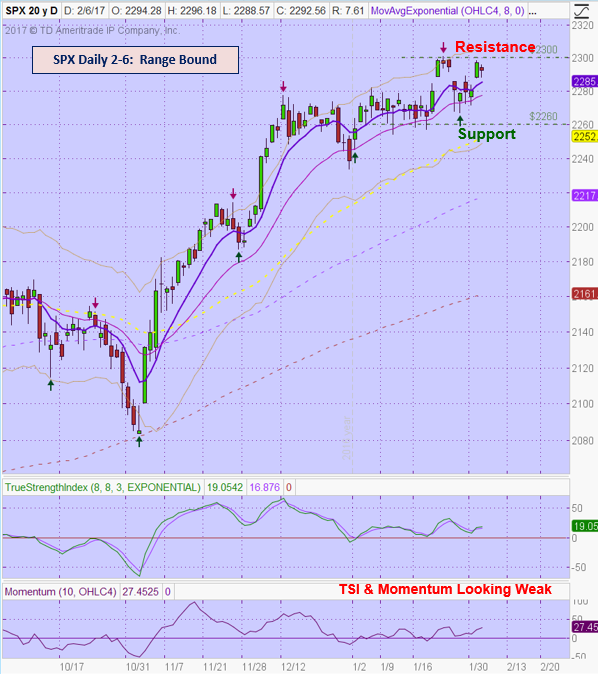
Today’s action was mixed with only the NDX showing positive price action for the Tracking Indexes. The SPX and RUT were down for the day but showed no signs of a major drop. The SPX continues to work within a trading ranged bracketed between support ant 2260 and resistance at 2300. The Island Top formation is still valid marking the top level of resistance. Because we know the historical price action for a post-election market tends to sell off in February, if price gets near resistance opening a partial bearish position would be reasonable. To maintain a simple approach, I would look to open this position in the Russell inverse leveraged ETF, TZA. If one choose to trade either SPY puts or SPXU that would also allow downside exposure.
NDX continues to be the strongest of the Tracking Indexes has not pushed to any new highs for over a week. The daily Hanging Man reversal candle from 1/27 is still valid and shows resistance at the 5172 level. Daily and Weekly TSI and Momentum indicators are out of sync. These clues provide no current trade setups so waiting for pullbacks is currently appropriate.
The Russell sold off to the 8/20 moving average combo as price action continues in a price range that is drifting lower. Price action on the RUT may lead the way down if the indexes begin to weaken more.
SPX: Downside Market Short the SPY, SPY Puts or SPXU.
Preferred Long ETF’s: SPY, UPRO and SPXL
NDX: Downside Market Short the QQQ, QQQ Puts or SQQQ.
Preferred Long ETF’s: QQQ and TQQQ
RUT: Downside Market Short the IWM, IWM Puts or TZA.
Preferred Long ETF’s: IWM and TNA
The How to Make Money Trading Stock Show—Free Webinar every Friday at 11:00 a.m. PDT. This weekly live and recorded webinar helped traders find great stocks and ETF’s to trade with excellent timing and helped them stay out of the market during times of weakness.
How to Make Money Trading Stocks on Friday, Feb 10th
Register now for the next live webinar at the link below:
Register Here: https://attendee.gotowebinar.com/register/7562489734728631809
Time 11:00 a.m. PDT
To get notifications of the newly recorded and posted How to Make Money Trading Stocks every week subscribe at the Market Tech Talk Channel: https://www.youtube.com/c/MarketTechTalk
Index Returns 2017 YTD
ATTS Returns for 2017 YTD
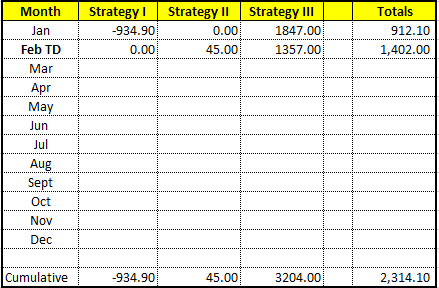
Percent invested initial $116.6K account: Strategies I & II invested at 13.76%; Strategy III invested at 26.6%.
Current Strategy Performance YTD (Closed Trades)
Strategy I: Down -$934.90
Strategy II: Up $45.00
Strategy III: Up $3204.00
Cumulative YTD: 1.98%
Active Trend Trading’s Yearly Objectives:
– Yearly Return of 40%
– 60% Winning Trades
– Early Warning Alert Target Yearly Return = 15% or better
For a complete view of specific trades closed visit the website at: https://activetrendtrading.com/current-positions/
Updated first full week of each month. The next update after first week in February.
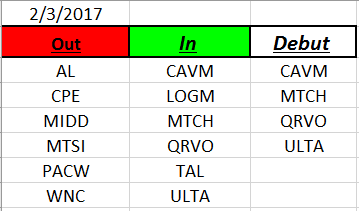
Outs & Ins: CAVM, MTCH, QRVO and ULTA made their debut on this weekend’s IBD 50 list. This is QRVO’s first visit to the list. Each of the inductees are extended at a level of resistance like many of the other stocks on the list.
This week’s sort for the fundamentally strongest stocks resulted in the following list. IDCC, NVDA, UBNT, ESNT and THO. THO is closest to an entry but is not launching off the moving averages. NVDA, UBNT have earnings on the 9th and ESNT following on the 10th. None of these are at a buy point. Watch IDCC for any bounce off the 8/20 moving average combo. IDCC has earnings scheduled 2/23 BMO.
Share Your Success: Many of you have sent me notes regarding the success you are having with the Active Trend Trading System. Please send your stories to me at dww@activetrendtrading.com or leave a post on the website. Thanks.


