Over the election period we are reformatting the Trader Report. Next edition will be out after the market on November 21st.
Good Day Traders,
Overview & Highlights: Another great article in this week’s edition from Mike Trager. Mike provides another look at Reversion to the mean from a long-term perspective. The two major events over the next few days are the Fed’s decision on Wednesday and the Election November 8th. At this point the market is stuck in a range with a slightly negative bias for both the SPX and RUT. I’ll focus this week on selling premium and trading off of support and resistance.
Webinars: At Active Trend Trading we offer two webinars per week to provide training plus trade and market updates. See the schedule below for the next webinars.
The How to Make Money Trading Stock Show—Free Webinar every Friday at 11:00 a.m. PDT. This weekly live and recorded webinar helped traders find great stocks and ETF’s to trade with excellent timing and helped them stay out of the market during times of weakness.
How to Make Money Trading Stocks on Friday, Nov 4th
Register now for the next live webinar at the link below:
Register Here: https://attendee.gotowebinar.com/register/2177817353127039747
11:00 a.m. PDT
Next Training Webinar: Nov 2nd
For Premium Members, our Wednesday evening training is developing some fantastic traders!
Topic: Power of Compounding and Margin
Managing Existing Trades: Positions open for 3 strategies.
Strategy I Portfolio Building:
Strategy I Weekly Results Week ending 10/28:
NUGT: Profit of $197
GRUB: Profit of $232.05
GIMO: Loss of $291.00
BGS: Loss of $247.50
Trade 1: Opened position in NUGT on 10/12 at 11.50
Target 1 = 10% hit on 10/13 sold ½ position for a profit of $262.20
Target 2 = 25%-35% sold 130 shares for a profit of $416.00
Stop Loss = Trailing Stop at 13.50 stopped at 13.47 for a profit of $197.00
Total Profit of $875.20
Trade 2: Opened position in GRUB on 10/13 at 40.60 (Pre Earnings Trade)
Target 1 = Fib Retracement at 41.99; 10/18 hit T1 Sold at 41.99 for a profit of $118.15
Target 2 = 10% or close on 10/25 prior to Market close; Closed prior to earnings at 43.33 for a profit of 232.50
Stop Loss = Breakeven
Earnings on 10/26 BMO
Total Profit of $350.20
Trade 3: Opened position in GIMO on 10/18 at 50.25 (Pre Earnings Trade)
Target 1 = 5%
Target 2 = 10% or close on 10/25 prior to Market close
Stop Loss = 4% from purchase price, hit stop sold at 48.31 for a loss of $291
Earnings on 10/27AMC
Trade 4: Opened position in BGS on 10/20 at 48.15 (Pre Earnings Trade)
Target 1 = 5%
Target 2 = 10% or close on 10/25 prior to Market close
Stop Loss = 4% from purchase price Stop hit at 46.50 for a loss of $247.50
Earnings on 10/27AMC
Trade 5: Opened position in THO on 10/25 at 81.49
Target 1 = 5-10%
Target 2 = 10-20%
Stop Loss = 4% of purchase price
Strategy II Income Generation: 1 Open Position
Strategy I Weekly Results Week ending 10/28:
GOOGL: Loss of $420
Trade 1: Opened 1 contract of GOOGL 28Oct 840C at 14.60
Target 1 = $20 or GOOGL at 840
Stop Loss = Close the day of earnings 10/27 AMC, hit time stop day of earnings closed at 10.00 for a loss of $420
Trade 2: Opened 3 contract of BABA 4Nov 105C at 3.20
Target 1 = $5 or BABA at 109 sell 2 contracts
Stop Loss = Close the day prior to earnings 11/2 BMO
For members wanting to better understand this Strategy there is a very good training video at: https://activetrendtrading.com/basic-option-strategy/
Strategy III Wealth & Income: Three positions opened
Closed the first TSLA LEAPS Strangle which was opened on 9/28/15 for a 100% profit on 9/2/16
Strategy III Weekly Results Week ending 10/28:
SPY: Profit of $220.00
TSLA: Profit of $104.00
NUGT: Loss of $306.00
Trade 1: Foundation Position is 4 contracts of SPY Jan17 205C and 4 contracts of SPY Jan17 200P Current Trade—Currently Up 32.11%; Premium Collected since opening trade on 1/4/16 = $9,025
10/28 sold 4 contracts of SPY 4Nov 211.5P at 1.08; potential profit $432
Trade 2: (Long TSLA Jan17 250C & Long Jan17 220—Closed on 9/2 for 100% gain since 9/29) + New Positions Jan17 210C and 220P: Current Position Total Invested $14,900. Currently Up 86.09%: Premium Collected since opening trade on 9/28/15 = $15,688.50 + New Positions at $6,153.50 = Total Collected $21,842
Waiting for proper entry timing
Trade 3: Long NUGT Jan18 18.4C + NUGT Jan18 18.4P opened 9/. 4 contracts each side of the straddle for total investment of $6,720. The required weekly premium to collect each week to achieve a 100% return by Jan 2018 is $191.43 per week.
10/28 sold 4 contracts of NUGT 4Nov 12.5P at 0.57; potential profit of $228
Tip for Experienced Option Traders: Occasionally after a weekly trade goes against me but the trend appears to be changing I will add one naked contract over and above my foundation position and close this out after it gains at least half of the premium I’ve collected. Doing naked options is not for everyone and I keep my risk small by only doing one contract above my covered limit. In other words, if I can sell 4 contract covered by my long leaps I’ll sell one additional. This helps hedge the losses a bit but it this tactic is not without risk and must maintain a tighter stop than I would normally use with the regular position.
Note: We do our best to get both text alerts and email alerts out in a timely manner, occasionally there will be trades that are missed because of delay in the Text or Email alert applications. Additionally, please double check with your broker to assure they allow spread trades like we do with Strategy III. Some do and some don’t.
Additionally, it is crucial when selling premium against the Long LEAPS position that the premium collected cover the weekly cost of holding the LEAPS plus an additional amount to over this amount as a gain. This is one of the reason I sell premium of weekly options that are close to be “At The Money”. I base my selling on the expected move during the next week. If one is not bringing enough weekly premium this trade will not work out as well and may wind up being a losing trade.
Several members have asked about this strategy and a more detailed explanation is available at: https://activetrendtrading.com/wealth-and-income-strategy/
I posted a video about how to choose the weekly options to short for this strategy. It can be viewed at: https://activetrendtrading.com/videos/
Additionally, some of these trade may be selling weekly puts on up trending stocks. If you are interested in parallel trading this strategy register at this link: http://forms.aweber.com/form/99/1278533099.htm
Early Warning Alerts for Leveraged Index ETFs: Last Trigger: 9/14. Waiting new signal or secondary trigger.
EWA Account Return to date: 12.09%
The Early Warning Alert Service hit all eight major market trading points in 2015. See this brief update video for more details: Early Warning Alerts Update Video or at https://youtu.be/GJwXCL4Sjl4
If simplifying your life by trading along with us using the index ETF is of interest, you can get the full background video at: https://activetrendtrading.com/etf-early-warning-alerts-video/
Potential Set Ups for this week: Even though the probability of a rate hike coming from the Fed meeting this week is very low, this event will be followed rapidly by the election on November 8th. With all the news this weekend about the FBI reopening the Clinton investigation, the outcome of the election is up in the air. This provides uncertainty and a touchy market. What other surprises are out there? Like we’ve been doing over the past couple of months, I will stay light on long term trades and focus on shorter term. Continue to trade Strategy III between support and resistance using the 1-hour Intraday charts to time selling premium. Long Strategy I trade will require a very compelling chart to enter. I will continue to trade ½ positions until the Indexes provide a solid direction either up or down. Will there be a Santa Claus rally this year? At this point in may be muted and short lived if the Fed raises rates in December. Remember “CASH” is a position also and sometimes the most favorable with all the uncertainty about.
I still like NUGT off identifiable & established levels of support. This is a highly volatile ETF for gold miners. The ideal way to trade it is to know how much it usually runs after a bounce and then plan to take profits during the run not at absolute profit projections. Using this strategy should open the door to profits in the 10%-25% range within a very few days. So we will have to be quick. Mid-week I will provide an in depth analysis of NUGT covering why I think this is a good trading candidate.
Pre-Earnings Trade: The following candidates may provide some Pre-earnings opportunities: GRUB (open position), GIMO (open position), BABA, MOMO, SIMO, MXL, CPE and NVDA.
Trades for Week of 10/29: Waiting for the Fed
Mike’s Macro Market Musings: Reversion Revisited
One of the primary issues currently being ignored by the markets is the inherent risk of mean reversions. Mean reversions are one of the most powerful forces in the financial markets as, like gravity, moving averages provide the gravitational forces around which prices oscillate. This concept applies in all time frames, whether on relatively shorter charts such as the daily and weekly charts or on longer monthly and quarterly charts. The process of mean reversion is one of the pillars upon which the Active Trend Trading System is built as well as the Early Warning Alert service. Since the focus of these columns is primarily on longer term and more macro considerations, let’s examine this concept of mean reversion on some monthly and quarterly charts.
The chart below shows the long-term view of the S&P 500 on a quarterly basis relative to its 24 quarter (or 6 year) moving average and a 24 period Bollinger Band set at 2 standard deviations from the 24-period moving average.
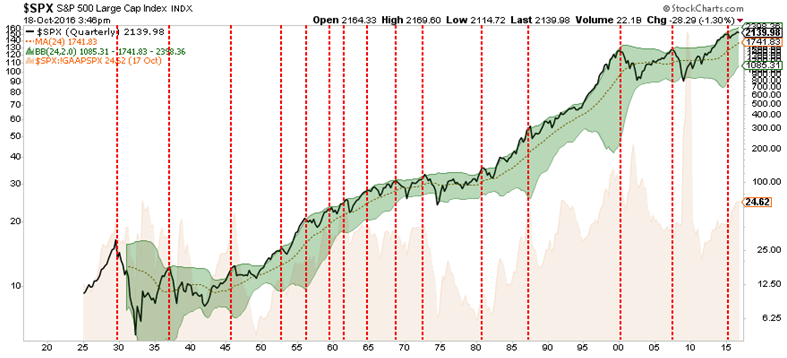
Not surprisingly, when prices deviate too far from their underlying moving average (2-standard deviations from the mean) there is generally a reversion back to the mean, or worse (or better). As you will notice, the bear markets in 2000 and 2007 were not just reversions to the mean but rather a massive reversion to 2-standard deviations below the mean. Like stretching a rubber band as far as possible in one direction, the snap-back resulted in large advancing cyclical bull markets.
The chart below brings this idea of reversion into a bit clearer focus. The 3-year average annual real return of the S&P 500 is overlaid against the inflation-adjusted price index itself.
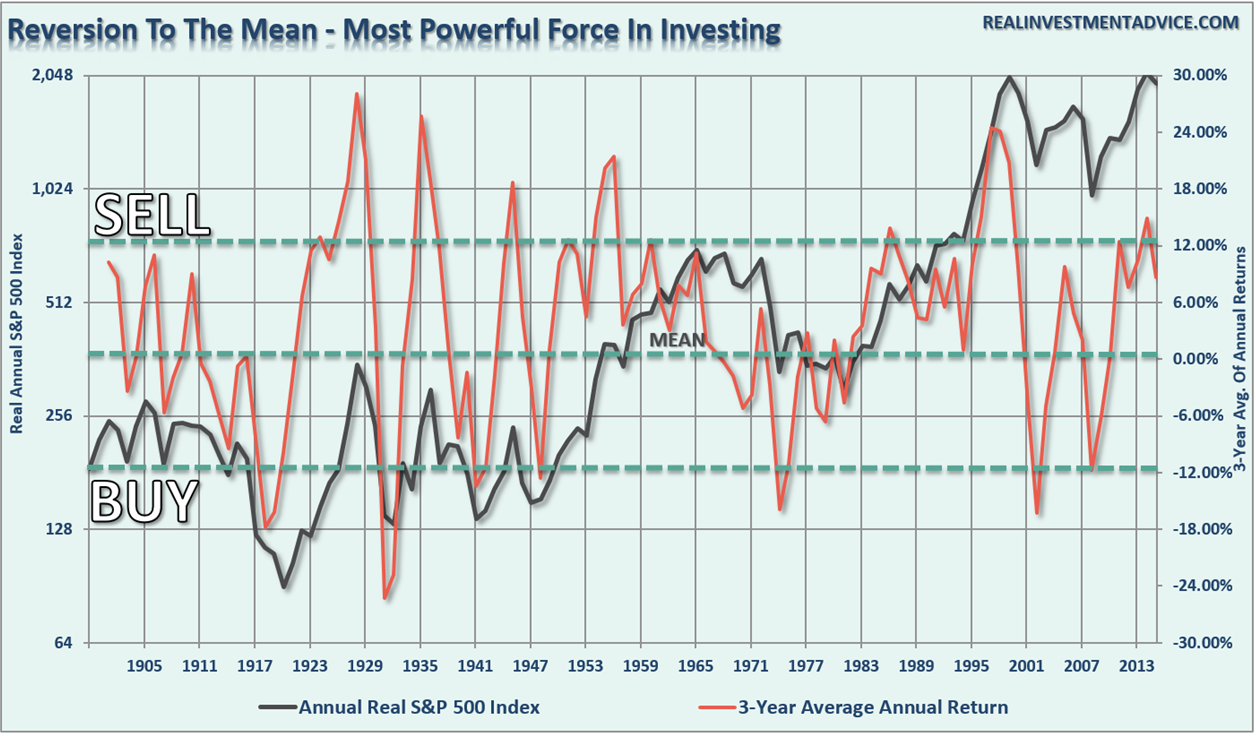
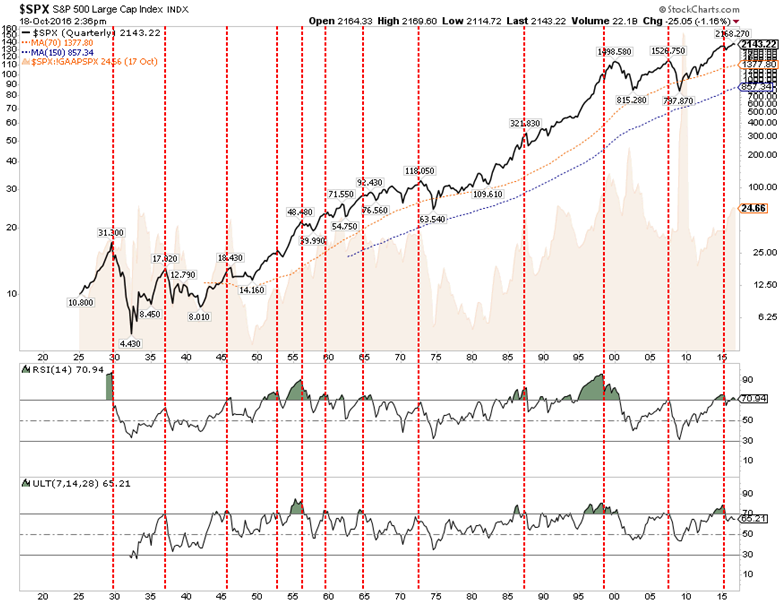
This chart shows that over a period of more than 100 years, whenever the 3-year annual return of the S&P 500 has been more (or less) than 12% away from its historical average, the average annual return going forward from those peaks and troughs has reverted to its long term norm and even overshot it in the process of doing so. Note that this extreme in 3 year annual returns was surpassed early in 2015 and has already rolled over as the market has struggled to advance since then. These circumstances have not presented themselves very often over the past 100+ years, but when they have, they seem to have been pretty meaningful. While this analysis does NOT mean the market is set to crash, it does suggest that a reversion in returns is likely. Unfortunately, the historical reversion in returns has often coincided at some juncture with a rather sharp decline in prices. Much of this perspective can be validated by the following charts, which are copied and pasted from elsewhere and which I provide for informational purposes without commentary or explanation since I believe they mostly speak for themselves.
None of the above information is meant to help with market timing. What it can be useful for is longer term portfolio and investment planning. From the lows in March, 2009, the S&P 500 has more than tripled, advancing more than 200%, and the Nasdaq has quadrupled, having advanced more than 300%. I believe it to be unreasonable and unrealistic to expect similar returns over the next 7 years or so; the principles of mean reversion and overshoots applies to annual investment returns just as much as it does to anything else. While the QE, ZIRP, and NIRP policies of the central banks over the past few years has likely delayed the onset of this process of mean reversion, it has not eliminated it.
The central banks increasingly appear to be “tapped out” in terms of their ability to keep financial markets artificially inflated. Even Mario Draghi, ECB head, just this past week said out loud that “nothing lasts forever” in reference to central bank policies and actions over the past several years. I expected a sharp downward reaction by the markets in reaction to that statement, which has not happened. At least, not yet.
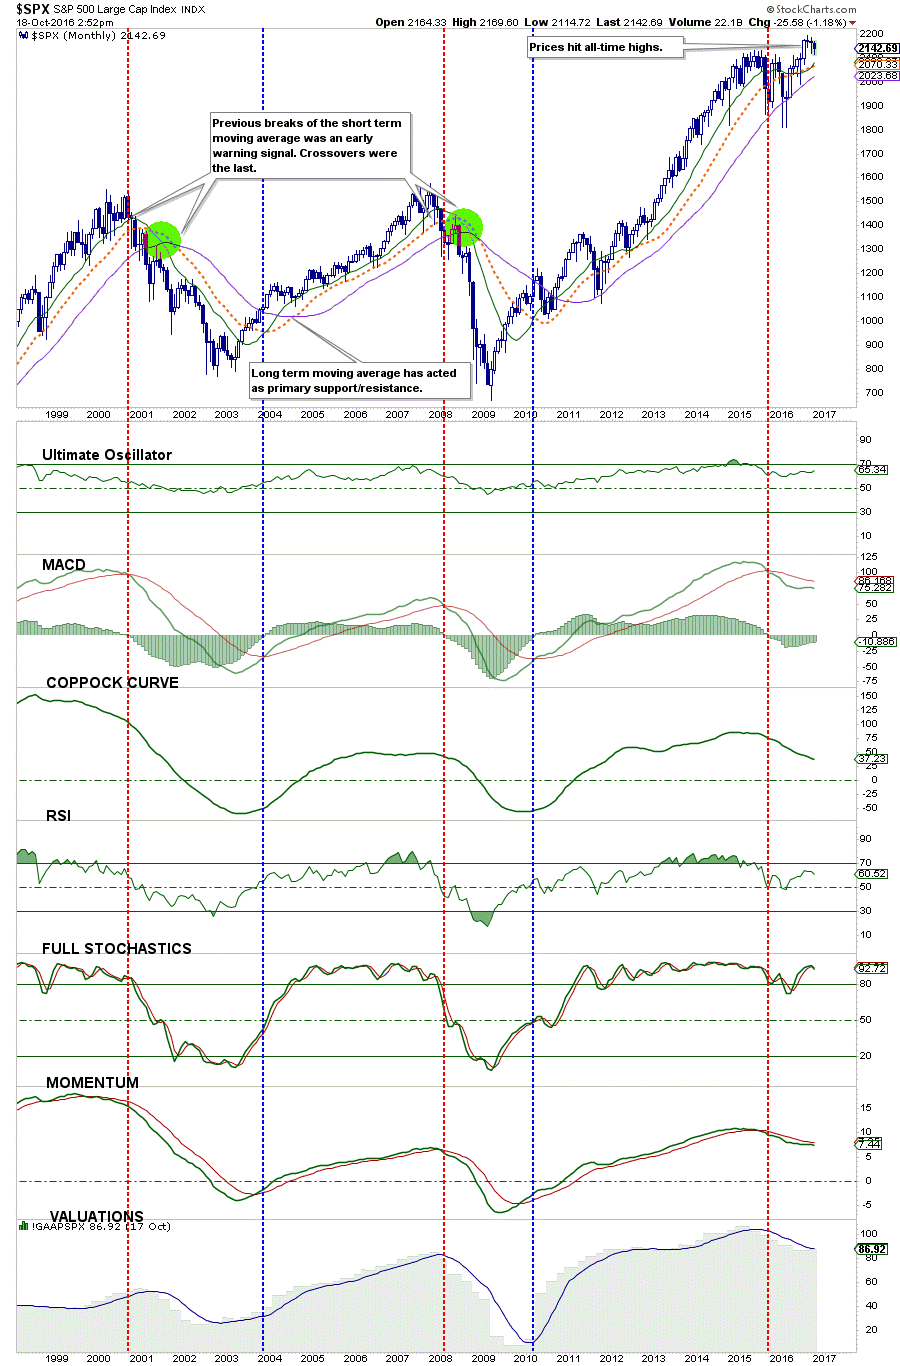
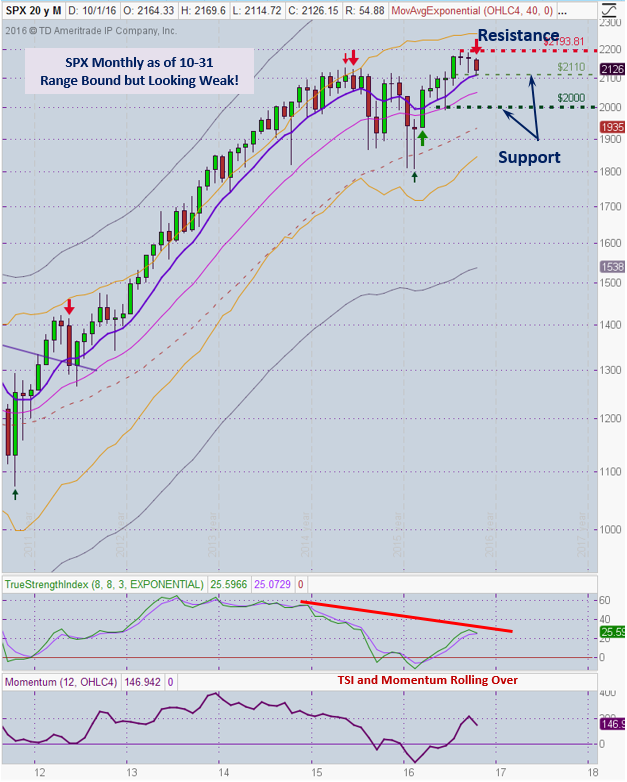
General Market Observation: With this being the end of October a view of how the 3 Tracing Indexes did in October is appropriate. Both the SPX and RUT are turning over on a monthly chart. Oscillators for both have rolled over and the TSI has crossing to the downside. Remember the Monthly charts have a longer-term outlook and while there may be brief bounces countertrend, the longer-term outlook for both indexes is weak. Both Indexes are showing negative divergence on the Monthly TSI. The NDX thus far is holding up best, but finished the month with a Bearish Harami reversal signal.
Two extra market moving events will take place over the next 8 days. First the Fed reports out on Wednesday. While no rate action is expected the tone of the decision could telegraph the probability of December’s action. The Fed wants to raise rates and remaining credibility is on the line. Then there’s the Presidential Election. Regardless of your choice for President, the outcome has the potential of tipping the market either up or down. At this point trading the indexes off support and resistance for quick trades is one way of limiting exposure with manageable risk. Staying in cash is also an excellent choice with these two unknowns hanging over the market.
The monthly chart of the SPX shows an Index that looks prime to rollover at the slightest unexpected event. August and September provide two spinning top doji’s at resistance. Today price action closed at support of the 2110 level. If this support breaks it could be a quick trip to 2000. This would reflect a drop of about 9% from this year’s high and potentially provide enough of a relief to trigger a rally. This potential rally could be our only gift from Santa this year. As indicated above I will continue to wait for price action to revisit either support or resistance and stay out of the way when prices are in between.
SPX: Downside Market Short the SPY, SPY Puts or SPXU.
Preferred Long ETF’s: SPY, UPRO and SPXL
NDX: Downside Market Short the QQQ, QQQ Puts or SQQQ.
Preferred Long ETF’s: QQQ and TQQQ
RUT: Downside Market Short the IWM, IWM Puts or TZA.
Preferred Long ETF’s: IWM and TNA
The How to Make Money Trading Stock Show—Free Webinar every Friday at 11:00 a.m. PDT. This weekly live and recorded webinar helped traders find great stocks and ETF’s to trade with excellent timing and helped them stay out of the market during times of weakness.
How to Make Money Trading Stocks on Friday, Nov 4th
Register now for the next live webinar at the link below:
Register Here: https://attendee.gotowebinar.com/register/2177817353127039747
11:00 a.m. PDT
To get notifications of the newly recorded and posted How to Make Money Trading Stocks every week subscribe at the Market Tech Talk Channel: https://www.youtube.com/c/MarketTechTalk
Index Returns YTD 2016

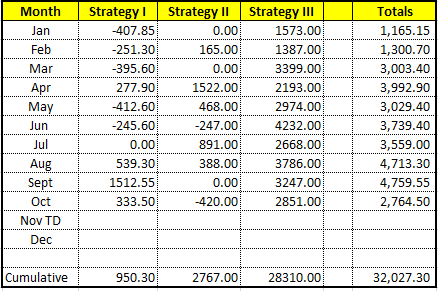
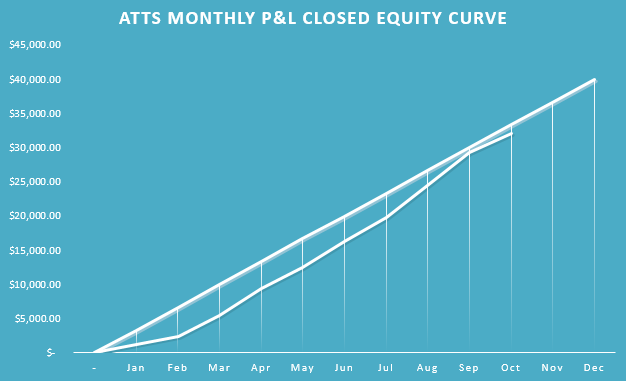
ATTS Returns for 2016 through Oct 31, 2016
Percent invested initial $100K account: Strategies I & II invested at 14.0%; Strategy III invested at 20%.
Current Strategy Performance YTD (Closed Trades)
Strategy I: Up $950.30 or +1.35%
Strategy II: Up $2767.00 or +2.77%
Strategy III: Up $28,310.00
Cumulative YTD: 32.03%
Active Trend Trading’s Yearly Objectives:
– Yearly Return of 40%
– 60% Winning Trades
– Early Warning Alert Target Yearly Return = 15% or better
For a complete view of specific trades closed visit the website at: https://activetrendtrading.com/current-positions/
Updated first full week of each month. The next update after first week in November.
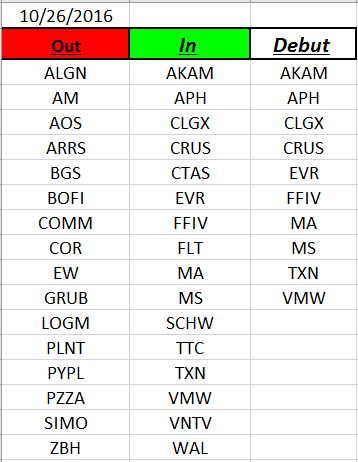
Outs & Ins: Twenty percent of the IBD 50 was swapped out this weekend. Stocks making their yearly debut include: AKAM, APH, CLGX, CRUS, EVR, FFIV, MA, MS, TXN and VMW. Several of these have been on the IBD 50 list in past years. Of the ten stocks added to this week’s list none are at potential buy trigger points. They all have either broke out after earnings and are extended from the daily moving averages or are flashing sell signals.
Watch GRUB for more downside if the ledge gives way at 37.72. FB reports earnings afterhours on 11/2. Worth watching to the upside include: HQY, VEEV, BUFF and PYPL.
Share Your Success: Many of you have sent me notes regarding the success you are having with the Active Trend Trading System. Please send your stories to me at dww@activetrendtrading.com or leave a post on the website. Thanks.