Good Day Traders,
Overview & Highlights: I was thinking this week about how remarkably simple it is to work the Active Trading System using the great stable of ETFs based on 3 Indexes, 2 Industries and 2 Commodities. All one needs to do is be patient and persistent in observing and reviewing 7 entities. Providing both Non-Inverse and Inverse opportunities provides flexibility regardless of trade direction on the primary Indexes. I am really looking forward to some seasonality trades coming up over the next few weeks and months. 2017 continues to shape up as a year for Explosive Growth.
Upcoming Webinars: At Active Trend Trading we offer four webinars per week to provide training plus trade and market updates. See the schedule below for the next webinars.
After Market Monday’s—Free Fast Paced Webinar every Monday after the Market closes at 1:10 p.m. PDT. Invitations are posted weekly at: https://www.facebook.com/ActiveTrendTrading/
How to Make Money Trading Stock Webinar—Free Webinar every Friday at 11:00 a.m. Pacific Time. This weekly live and recorded webinar helped traders find great stocks and ETF’s to trade with excellent timing and helped them stay out of the market during times of weakness.
How to Make Money Trading Stocks on Friday, May 12th
Register now for the next live webinar at the link below:
Register Here: https://attendee.gotowebinar.com/register/7952554681009498371
Time 11:00 a.m. PDT
Next Training Webinar: May 10th
For Premium Members, our Wednesday evening training is developing some fantastic traders
Topic: Risk Management – Never Try to Get Even!
** Friday’s “Final Hour”: May 12th **
Time 12:00 p.m. PDT
For Premium Members, provides trades and set ups during the final hour of weekly trading.
Managing Current Trades: Positions open in Strategies I, II & III
Strategy I: 2 Positions opened.
NUGT: Opened at 29.21 on 5/8/17
UCO: Opened at 15.69 on 5/8/17
FAS: Opened at 42.54 on 4/18/17 – Closed ½ for Profit of $219.60; Closed last ½ on 5/9 for profit of $131.40. Total Profit = $351
Strategy II Basic Options: Waiting Setups
For members wanting to better understand this Strategy there is a very good training video at: https://activetrendtrading.com/basic-option-strategy/
Strategy III Wealth & Income: Foundation positions are open in SPY and TSLA. Total capital for Strategy III = 17% or $19.93K.
SPY: Sold 2 contracts of 12 May 240C at 0.89
TSLA: Hit Stop Loss on both TSLA positions: Loss = -$782
NUGT: LEAPS Straddle Closed—Position not achieving cashflow. Too much effort for the payoff. Trading directionally with the Gold ETFs much more efficient.
Results last week:
SPY: Profit = $61
TSLA: Profit = $423
Running Performance premium collected plus residual value of LEAPS
SPY: +15.67%
TSLA: +85.47%
NUGT: +1.37%
Combined: 49.34%
If TSLA reaches 90%-100% return (combined premium collected + value of the Straddle) I will close the current position and reopen a new straddle to trade the rest of the year. If price continues to rally with TSLA this may achieve this target when price reaches approximately the $330 level. Stay tuned.
Tip for Experienced Option Traders: Occasionally after a weekly trade goes against me but the trend appears to be changing I will add one naked contract over and above my foundation position and close this out after it gains at least half of the premium I’ve collected. Doing naked options is not for everyone and I keep my risk small by only doing one contract above my covered limit. In other words, if I can sell 4 contract covered by my long leaps I’ll sell one additional. This helps hedge the losses a bit but it this tactic is not without risk and must maintain a tighter stop than I would normally use with the regular position.
Note: We do our best to get both text alerts and email alerts out in a timely manner, occasionally there will be trades that are missed because of delay in the Text or Email alert applications. Additionally, please double check with your broker to assure they allow spread trades like we do with Strategy III. Some do and some don’t.
Additionally, it is crucial when selling premium against the Long LEAPS position that the premium collected cover the weekly cost of holding the LEAPS plus an additional amount to over this amount as a gain. This is one of the reason I sell premium of weekly options that are close to be “At the Money”. I base my selling on the expected move during the next week. If one is not bringing enough weekly premium this trade will not work out as well and may wind up being a losing trade.
Several members have asked about this strategy and a more detailed explanation is available in this updated video at: https://activetrendtrading.com/wealth-and-income-strategy/
I posted a video about how to choose the weekly options too short for this strategy. It can be viewed at: https://activetrendtrading.com/videos/
Additionally, some of these trades may be selling weekly puts on up trending stocks. If you are interested in parallel trading this strategy register at this link: http://forms.aweber.com/form/99/1278533099.htm
Early Warning Alerts for Leveraged Index ETFs: Last Trigger: 11/4—Second Chance Entry on 4/18/17 on TQQQ at 85.44. Closed total 4/18 position for an average gain of 6.83%. Waiting new setup.
EWA Account Return for 2017: 5.43%
The Early Warning Alert Service alerted on all market lows in 2016. See the link below for the new video for 2016 that highlights entry refinements that will provide improved entries even in environment like 2016. In 2016, the entry triggers were challenging because of the number of straight off the bottom moves. Mike and I have analyzed this and have tested adjustments in place going forward.
EWA 2016 Update Video: https://activetrendtrading.com/early-warning-alerts-update-for-2016/
Potential Set Ups for this week: Two Rule 1 Entries were provided this week so far in UCO and NUGT. If this current move up is the beginning of a seasonal move I will add to the current positions at appropriate buy points.
TLSA reported earnings last week. I look for TSLA to continue moving at the whim of news. After today’s up move there is negative press out about an analyst being skeptical about future margins. Let’s see how this news impacts price action tomorrow. I’m currently waiting for setup for either a Strategy I or II trade using the Intraday hourly chart for triggers of support or resistance.
Gold: Tends to rally in June or July with the rally lasting until late August or early September. This coincides with the seasonal weakening in the dollar. Last year NUGT rose of 150% during this rally. While we do not know if a similar move will take place this year, I will look for buying opportunities during the May, June and July basing period. Between now and July I would like to see Seasonality kick in. Then I will enter up to a double position.
Financials: Tends to rally through the end of April, but has lagged this year. Price is looking for support at the 100-day moving average so a move up through the end of April may take place. The biggest move in the Financials tend to take place in October. Last year FAS moved over 50% from late October through the end of the year
Biotech’s: Tends to rally in June-July through the end of the year. IBB is showing a reversal from a lower high. Last year LABU provided two 80% moves between June and December. LABU is on my list today for potential buys.
Oil: Tends to rally after February, but not this year. Oil has not been following the seasonal pattern. Last year UCO had multiple runs of over 40% between April and December. Currently price is stuck in a range on UCO between the 16 and 24 levels. Bought a partial position in UCO on 5/8.
Indexes: Covered in General Market Observations
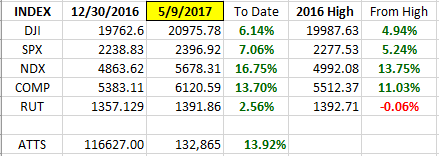
General Market Observation: Seems like the 3 Tracking Indexes are following their own script moving into the mid-section of May. No price action clues that a correction or significant pullback is imminent. But, what are other clues associated clues saying?
SPX: Stalling at the resistance level of 2400. Oscillators on the daily chart appear to be weakening and weekly charts are showing negative divergence. Note that even the Market Forecast Oscillator showed a three-line cluster in the overbought zone. This can be indicative that a more significant drop is in the offing. Will stalling action at an established resistance level lead to a more significant correct? We shall see.
The candle patterns accompanying this stalling action are a Hanging Man & Bearish Engulfing. Both are bearish reversal signals. Will the SPX followed simply modulate between support and resistance until October? If it does then we will trade between the various levels of support and resistance.
NDX: Pushing higher on but with significant negative divergence showing up on the weekly charts. Price action on the Index is stronger than the other two Indexes. Prices are extended, and the trade on NDX is wait for pull back setups even if triggered on intraday hourly charts.
RUT: The Russell is finding support at 1380-1390 levels. Momentum has dropped below the “zero” line so prices may search for lower support. At this point there is neither a long nor short trade on the RUT EFTs.

SPX: Downside Market Short the SPY, SPY Puts or SPXU.
Preferred Long ETF’s: SPY, UPRO and SPXL
NDX: Downside Market Short the QQQ, QQQ Puts or SQQQ.
Preferred Long ETF’s: QQQ and TQQQ
RUT: Downside Market Short the IWM, IWM Puts or TZA.
Preferred Long ETF’s: IWM and TNA
How to Make Money Trading Stock Webinar—Free Webinar every Friday at 11:00 a.m. PDT. This weekly live and recorded webinar helped traders find great stocks and ETF’s to trade with excellent timing and helped them stay out of the market during times of weakness.
How to Make Money Trading Stocks on Friday, May 12th
Register now for the next live webinar at the link below:
Register Here: https://attendee.gotowebinar.com/register/7952554681009498371
Time 11:00 a.m. PDT
To get notifications of the newly recorded and posted How to Make Money Trading Stocks every week subscribe at the Market Tech Talk Channel: https://www.youtube.com/c/MarketTechTalk
Index Returns 2017 YTD
ATTS Returns for 2017 End of April Closed Trades
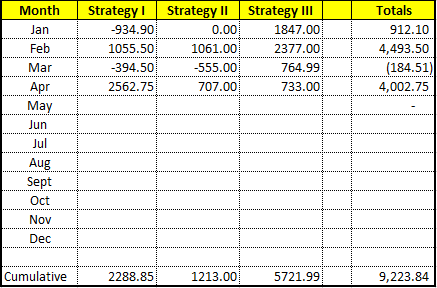
Percent invested initial $116.6K account: Strategies I & II invested at 9%; Strategy III invested at 17%.
Current Strategy Performance YTD (Closed Trades)
Strategy I: Up $2288.85
Strategy II: Up $1213.00
Strategy III: Up $5721.99
Cumulative YTD: 7.91%
Active Trend Trading’s Yearly Objectives:
-
- Yearly Return of 40%
- 60% Winning Trades
- Early Warning Alert Target Yearly Return = 15% or better
For a complete view of specific trades closed visit the website at: https://activetrendtrading.com/current-positions/
Updated first full week of each month. The next update after first week in June.
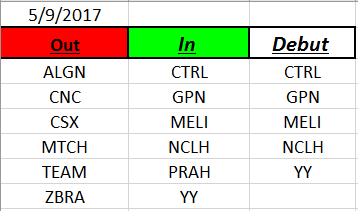
Outs & Ins: Five stocks make their debut on the IBD 50 mid-week. CTRL, GPN, MELI, NCLH and YY. None of the new stocks are close to a buy point, or they have earnings approaching rapidly.
The top stocks from the Fundamental Sort were: MELI, LRCX, AMAT, TAL, CGNX & PAYC
Share Your Success: Many of you have sent me notes regarding the success you are having with the Active Trend Trading System. Please send your stories to me at dww@activetrendtrading.com or leave a post on the website. Thanks.