Good Day Traders,
I attended the IBD Leaderboard Summit this morning before hitting the road for a family reunion this weekend. I like attending training sessions to continue refining the system processes. I now have greater understanding about how to use the Leaderboard that will directly benefit Active Trend Traders with stronger picks to both the upside and downside! It was great seeing many members at today’s session in San Francisco. I will be tracking what I find and may generate a second running list based on these highflyers for educational purposes.
_____________________________________________________
Thanks for all the great comments about the ATTS service and the “How to Make Money Trading Stocks” webinar that blast out every Friday at 10 a.m. Pacific. Please let others know about this great webinar! You can either join live or catch the replay on YouTube.
Here’s the link for next Friday’s Show: https://attendee.gotowebinar.com/register/2292481012495166722
For Premium Members our Wednesday evening training is developing some fantastic traders!
Mid-Week Market Sanity Check Topic: Candlesticks Part 4
_____________________________________________________
General Market Observation: Mike and I have been talking about the weakness under the hood of the Indexes for almost 3 months and today the tracking indexes may have pushed closer to the downturn we know is coming! Earnings are in full swing with several heavy weights reporting this week. AAPL and several other stocks disappointed and fell, but what was most interesting was how stocks that gapped up with earnings finished off weak. Take a look at AMZN, SWKS and SBUX. Each provided an initial gap up after earnings on Thursday but the buyers didn’t stick around to support the move and each finished with a bearish candlestick. SWKS was the worst. This type of behavior from a leading stock is not expected when the indexes are strong!
Each of the Tracking Indexes made Friday about searching for support, lower support. The daily indicators are reaching oversold zones so it would not be a surprise to see a bounce once stable support is found. Watch the charts to determine where stability may be and see if the buyers come in to support the theory!
SPX: Four hard days down to finish the week. Price action stopped on top of a support zone between 2080 and 2045. Prices came to rest on top of the long term uptrend line that has been in place for several years. Daily and weekly momentum dropped with one of the proprietary indicators I use showing that longer term momentum is also looking like more downside at worst or sideways movement at best is on the horizon. On all the indexes Friday provided acceleration to the downside as is evident with the larger bearish candle on the daily charts. Since topping tends to be a process it look a lot like the process is continuing but still has not capitulated totally to the downside yet. Friday’s plunge took us down to a 61.8% retracement of the recent up move. Stand by and wait for small candles or a reversal signal which could lead to a relief rally. At this point watch for a bounce to the 50% retracement level which is at 2088. If weakness shows up then the 200 day EMA is the first downside target.
Preferred ETF’s: SPY and SPXL
NDX: As the selling intensified on Friday the NASDAQ 100 fell to support at 4550 the previous breakout level. This level was tested 3 times over the past few months and was solid resistance. If similar strength shows up in its new role as support then price should bounce with at least a relief rally next week. I will use this level as a line of demarcation for potential trade set ups in either direction. The NDX just set a high for the year last week so a bounce to a lower high would be the classic failure pattern that could be a set up to the downside. Right now while this index is stronger than the other it can turn and catch up quickly to the others if downward momentum continues to accelerate. Indicators are aligned for a further fall.
Preferred ETF’s: QQQ and TQQQ
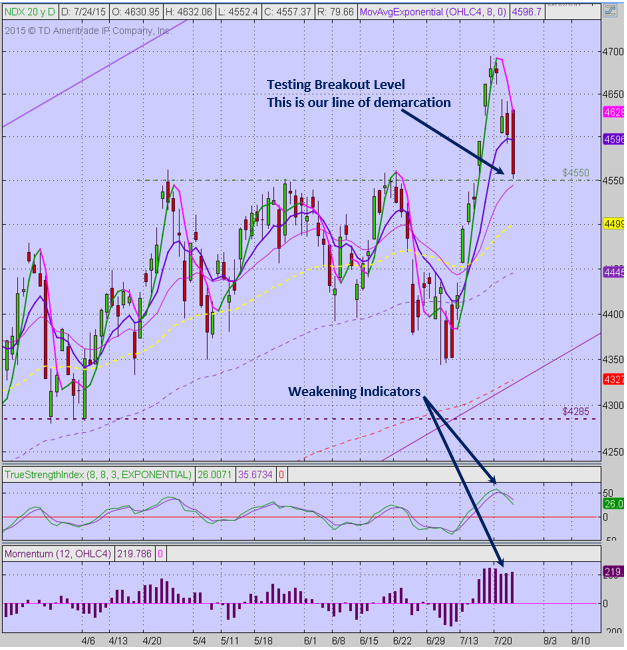
RUT: The Russell has put in a classic downside pattern rallying to a lower high and rolling over during the past seven days. A complete 100% retracement of the rally beginning on 7/7 is complete. Remember only a month ago the RUT was the strongest index and now it’s the weakest. The Fed’s push to tighten interest rates this year has been an influence on the Small Cap stock thus removing the tailwind and replacing it with a strong headwind for this index. It does seem like at least a brief bounce is in order, but it may try to do this from support between the 1210-1215 levels. The lower high is now in place and now we find out if a lower low is on the horizon.
Preferred ETF’s: IWM and TNA
_____________________________________________
The Early Warning Alert Service has hit all three major market trading point this year. See this brief update video for more details: https://youtu.be/PRLmPQLHjiI
If simplifying your life by trading along with us using the index ETF is of interest you can get the full background video at: https://activetrendtrading.com/etf-early-warning-alerts-video/
The How to Make Money Trading Stock Show—Free Webinar every Friday at 10 a.m. PDT. This weekly live and recorded webinar helped traders find great stocks and ETF’s to trade with excellent timing and helped them stay out of the market during times of weakness.
The “How to Make Money Trading Stocks” Show is back this Friday, July 31st
Ensure you get a seat by registering now at:
https://attendee.gotowebinar.com/register/2292481012495166722
To get notifications of the newly recorded and posted How to Make Money Trading Stocks every week subscribe at the Market Tech Talk Channel: https://www.youtube.com/channel/UCLK-GdCSCGTo5IN2hvuDP0w
The Active Trend Trader Referral Affiliate Program is ready. For more information or to become an Affiliate please register here: https://activetrendtrading.com/affiliates-sign-up-and-login/
_________________________
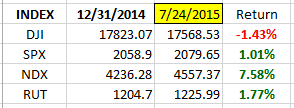
Index Returns YTD 2015
ATTS Returns for 2015 through July 24, 2015
Less than 10% Invested
Margin Account = +2.5% (Includes profit in open positions)
Early Warning Alerts = +3.08%
Active Trend Trading’s Yearly Objectives:
- Yearly Return of 40%
- 60% Winning Trades
For a complete view of specific trades closed visit the website at: https://activetrendtrading.com/current-positions/
Updated at the beginning of each month.
Managing Existing Trades: Our protective stops got us out of two long trades. FEYE provided a good profit of $618 for the week which was offset with a 2.16% or $384 loss in LCI. The short position on BITA was closed for total profit of $356 over the past two weeks.
I’m still long EPAM which was entered for a Pre-Earnings trade. T1 = 82 but this may be reduced to 78. Friday’s action was promising and almost provided a breakout before dropping. Price closed at the 20 day EMA so I’m not initiating the stop based on the 20 at this point. Trend remains up and holding with significant market weakness.
Special Trades: Wealth & Income Generation Strategy 3 Trades: I posted a video about how to choose the weekly options to short for this strategy. It can be viewed at: https://activetrendtrading.com/videos/
Currently short the Put Leg on this trade. With this trade I initiated a weekly position in the IWM Jul5 124P which is currently upside down on 5 contracts. To offset this and take advantage of time decay over the weekend I sold 2 contracts or the IWM Jul5 122P just before the close Friday. Last week there was a profit of $405 from short calls.
With a mild bounce I’ll look to close the short put trades for a profit and with market weakness sell the IWM weekly call legs at the appropriate time.
For those unaware of what this trade is about, we have two long Jan 2016 option positions. Each week we want to sell premium against this Put and Call position with two objectives. First cover the cost of the long Call and Put and then collect premium over and above this for both wealth and income generation between now and option expiration in January 2016.
Additionally some of these trade may be selling weekly puts on up trending stocks. If you are interested in parallel trading this strategy register at this link: http://forms.aweber.com/form/99/1278533099.htm
Pre-Earnings Trade: Keep an eye on CYBR, JUNO and GDDY for pre-earning runs. If we enter off a proper set up keep expectations low with 5%-10% being great returns for these short term trades. 36% of the IBD 50 report this week with the much of the remainder reporting over the first 2 weeks in August.
_________________________________________________
Potential Set Ups for this week: As discussed on Friday’s “How to Make Money Trading Stocks” webinar, the internals of the market and number of stocks holding up the current markets continues to decline. While long trades are acceptable off proper entry action points profits will be muted with a weak market. We keep our profit targets small and stop losses very tight.
Upside: HAWK and AYI top the list for this weekend.
Downside: Along with the Index ETFs SWKS, QIHU, QPRO, ILMN and AMZN look like potential downside candidates this week. SWKS with the huge bearish candle after earning is worth keeping on the radar!
Toss Ups: Stocks that could go either way next week include: CYBR and AMBA (potential double top).
Leveraged Index ETFs: Waiting for alert to reset for a new alert.
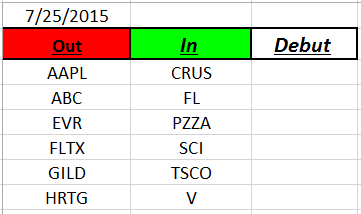
Outs & Ins: No new stocks on the IBD 50 this weekend. 36% of the stocks on the list report earnings this week so there could be some swap outs by the end of the week. A couple names to watch through earnings include: ELLI, VDSI, TASR, UHS and FB.
Comments and opinions written below this line of text may be provocative and only obliquely related to trading. Some may find these “Off the Wall” comments challenging to their outlook on life. I will not post any comments made on subject matter below this line, so if you disagree blast away.
OFF THE WALL

Off the Wall: Good golfers have bad rounds! When a good golfer has a bad round they don’t just run out and replace their swing nor their equipment. They know that bad rounds happen and are often related to other things rather than their system. They understand that all the practice of honing their skills increases the probability of their success but typically bad rounds are due to things outside their control. Wind, rain, fog, heat and cold all can have an effect on the outcome of their play. Did you know that if the temperature is cold a golf ball doesn’t fly as far? If the wind is with you the ball goes further. If the greens are hard an approach shot may bounce on the green and then over. Each of these variables are outside the control of the golfer. What the wise golfer does is make adjustment for conditions in an attempt to score as low as possible.
With golf the game is actually about how small can I keep my misses until the ball is at the bottom of the cup. Now really good golfers also recognize the need to practice before they play but that’s a thought for another day. The point here is that just because a few round may not be up to par the golfer must adjust expectations. They understand that some days are about playing defensively others are about going for it! The poor golfer or hacker are always looking for the magic club or holy grail or even divine intervention to excel. The truth is there are no magic bullets, holy grails or instant panaceas just a fundamentally sound system with lots of practice. Sounds a lot like traders. The good ones know their system and their hard work will pay off, the hackers just keep searching.
Share Your Success: Many of you have sent me notes regarding the success you are having with the Active Trend Trading System. Please send your stories to me at dww@activetrendtrading.com or leave a post on the website. Thanks.