Good Day Traders,
Overview & Highlights: This week may be very interesting and volatile week. Several of the big names like AAPL, FB and AMZN. Add to this the uncertainty of the Fed and we could see support and resistance tested several times. Note that the “How to Make Money Trading Stocks” Webinar is back on Friday at 11:30 a.m. PDT this week.
Webinars: At Active Trend Trading we offer two webinars per week to provide training plus trade and market updates. See the schedule below for the next webinars.
How to Make Money Trading Stocks on Friday, April 29th
Register Here: https://attendee.gotowebinar.com/register/6304738586288150019
Note this session will be at: 11:30 a.m. PDT
Next Training Webinar: April 27th
For Premium Members our Wednesday evening training is developing some fantastic traders!
Mid-Week Market Sanity Check Topic: Symmetry of Time and Price—How to be Patient
Managing Existing Trades: Positions open for all 3 strategies.
Strategy I Portfolio Building: Pre-earnings trade on SFM, PYPL & XRS. Earnings on each are the last week in April. It appears that there will be several additional pre-earnings trades setting up including FB if we’re patient.
Strategy I Weekly Results Week ending 4/22/16:
PYPL: Profit + $170.10
XRS: Profit + $501.20
Bought 180 shares of PYPL at 38.09
T1 = 5% -10% to close 100 shares–HIT
T2 = Attempt to hold remaining shares up to earnings and then close
Stop Loss = 36.56
Sold ½ of the position at 39.98 for profit over 4.96% or $170.10
Bought 140 shares of XRS at 50.14
T1 = 5% -10% to close 70 shares–HIT
T2 = Attempt to hold remaining shares up to earnings and then close–HIT
Stop Loss = 48.13
Sold ½ of the position at 52.99 for profit over 5.6% or $199.5
Sold second half of position at 14% gain or $501.20
Total Gain = $700.70
Bought 240 shares of SFM at 27.60
T1 = 5% -10% to close 120 shares
T2 = Attempt to hold remaining shares up to earnings and then close
Stop Loss = 26.49
Strategy II Income Generation: Open long PYPL Apr5 41C & FB Put Credit Spread
Strategy I Weekly Results Week ending 4/22/16:
PYPL: Profit + $180
Opened pre-earnings trade on PYPL. Bought 5 contracts of Apr5 41C at 0.60
Will close 3 contracts at 1.20 (100%) and hold the remainder up until earnings on 4/27 AMC
Price and Implied Volatility helped this trade! Closed 3 contracts at 1.20 for a profit of $180.
Opened speculative trade with the expectation that volatility will pick up between now and June. Bought 5 contracts of VXX Jun 19C at 1.42
Will let this trade play out over the next 4-5 weeks. I will close out 3 contracts at 2.84.
Strategy II stocks of interest for this week: TSLA, SPX & Index ETFs.
For members wanting to better understand this Strategy there is a very good training video at: https://activetrendtrading.com/basic-option-strategy/
Strategy III Wealth & Income Generation Trades: Two Foundational Positions are in place to sell weekly options against. The recalculated weekly revenue needed from these foundational positions was forward in an update report earning last week. My objective with this Strategy is to collect enough weekly premium during the life of the LEAPS Strangle on both SPY and TSLA to both pay for the capital invested and gain between 50% – 100%.
Tip for Experienced Option Traders: Occasionally after a weekly trade goes against me but the trend appears to be changing I will add one naked contract over and above my foundation position and close this out after it gains at least half of the premium I’ve collected. Doing naked options is not for everyone and I keep my risk small by only doing one contract above my covered limit. In other words if I can sell 4 contract covered by my long leaps I’ll sell one additional. This helps hedge the losses a bit but it this tactic is not without risk and must maintain a tighter stop than I would normally use with the regular position.
Note: We do our best to get both text alerts and email alerts out in a timely manner, occasionally there will be trades that are missed because of delay in the Text or Email alert applications. Additionally please double check with your broker to assure they allow spread trades like we do with Strategy III. Some do and some don’t.
Strategy II Weekly Results Week ending 4/22/16:
SPY: Profit + $284
TSLA: Profit + $192.00
Trade 1: Foundation Position is 4 contracts of SPY Jan17 205C and 4 contracts of SPY Jan17 200P Current Trade—Currently Up 5.5%; Premium Collected since opening trade on 1/4/16 = $2870
Sold 4 contracts of SPY Apr Week 4 207.5C at 1.49—potential profit $596. Bought back at 0.78 for a Profit of $284
Trade 2: Long TSLA Jan17 250C & Long Jan17 220—Current Trade—Currently Up 50.48%; Premium Collected since opening trade on 9/28/15 = $9193
Sold 1 contract of TSLA Apr Week 4 250P at 5.20 potential profit $505 will close when contract is between 0.50 & 1.00—Closed today at stop loss. Loss of $465
Sold 2 contract of TSLA Apr Week 4 240P at 4.10 potential profit $820 will close when contract is between 0.50 & 1.00—Closed for at an average of 0.725 for a Profit of $675
Waiting for this week’s trades for both SPY and TSLA.
Several members have asked about this strategy and a more detailed explanation is available at: https://activetrendtrading.com/wealth-and-income-strategy/
I posted a video about how to choose the weekly options to short for this strategy. It can be viewed at: https://activetrendtrading.com/videos/
Additionally some of these trade may be selling weekly puts on up trending stocks. If you are interested in parallel trading this strategy register at this link: http://forms.aweber.com/form/99/1278533099.htm
Pre-Earnings Trade: Some stocks will be setting up for the Q1 pre-earnings runs. In an up trending market many stocks will provide upside trades with expected returns between 5% – 20%. Here are some potential stocks that may provide pre-earning moves: TREE, SFM, STMP, RGR**, NVDA, STOR, BUFF, TSLA, SEDG, & MAA.
Pre-earnings trades can be a great supplement to the portfolio building portion of Strategy I. Depending on the stock and technical analysis they tend to be predictable and repeatable. For busy traders focusing on pre-earning opportunities can free one up from the necessity of constantly chasing stocks during other periods of the year. The process repeats four times a year and capturing a 5%-15% return four times a year can compound very nicely!
Potential Set Ups for this week: I would like to see some solid pullbacks to support for stocks on the watch list. SONC has pulled back and may be at a buy point. TSLA, NFLX and AMZN continue to provide trading opportunities for quick swing trades.
Upside: The stocks on the list are looking extended and ready for a healthy pullback that may be tradable depending on the strength of the Indexes. I will look for pre-earnings set ups and after earning potential trades.
Downside: If the Indexes pullback from current resistance zone look for weak stocks or go to the inverse Index ETFs. Some weak stocks include: THO, STMP, CALM & VRSK
On the Radar: Stocks & ETFs that could go either way include: UPRO, SPXU, TQQQ, SQQQ, TNA, TZA, TSLA (270 resistance/140 support), PYPL, AMZN, NFLX, ELLI, OLLI (Speculative), AHS, XRS, FB, AYI, OLED, RGR, NKE, KORS, TREE, SIX, ELS, SBUX & LGIH.
Stocks identified by ** that are close to a potential entry point.
Early Warning Alerts for Leveraged Index ETFs: Waiting for Second Chance Entry trigger and Alert reset.
The Early Warning Alert Service hit all eight major market trading points in 2015. See this brief update video for more details: Early Warning Alerts Update Video or at https://youtu.be/GJwXCL4Sjl4
If simplifying your life by trading along with us using the index ETF is of interest you can get the full background video at: https://activetrendtrading.com/etf-early-warning-alerts-video/
General Market Observation: Several events this week may provide a catalyst for higher volatility and price moves between levels of support and resistance. The Fed reports out on Wednesday so often waiting for the Fed dampens daily movement. Add to this some of the big name stocks like APPL, FB and AMZN reporting earnings between Tuesday and Thursday the Indexes could end up either pushing higher or breaking the current uptrend and finishing the week lower. I like to keep most of my powder dry going into the Fed meeting because of the unpredictability of both the Fed decision and then the follow on report. I will wait for price action on the Tracking Indexes to either test support or resistance for potential trade opportunities but will most likely be flat any Index ETFs while the Fed reports.
Since all three of the big names reporting this week are members of the NDX and SPX price action on both Indexes could potentially gyrate wildly. The NDX was showing the weakest technical pattern of the Tracking Indexes finishing the week with a weekly Bearish Spinning Top below the down trend resistance line that’s been in place since December of last year. There is plenty of support at the 50, 100 & 200 day moving averages and other price level supports so if price continue to fall look for bounces from one of these areas. A healthy 38.2% retracement would bring prices to the 4309 level. Of course there is a potential head & shoulders pattern shaping up on the daily chart with the left shoulder and head formed. AMZN, FB and AAPL will be the drivers for what happens next.
The RUT provided the most strength last week finishing Friday with a positive gain. If the Fed does not raise rate and puts out a dovish statement the RUT may run to the upside some more. Technical resistance comes in at the 1160 and 1200 levels.
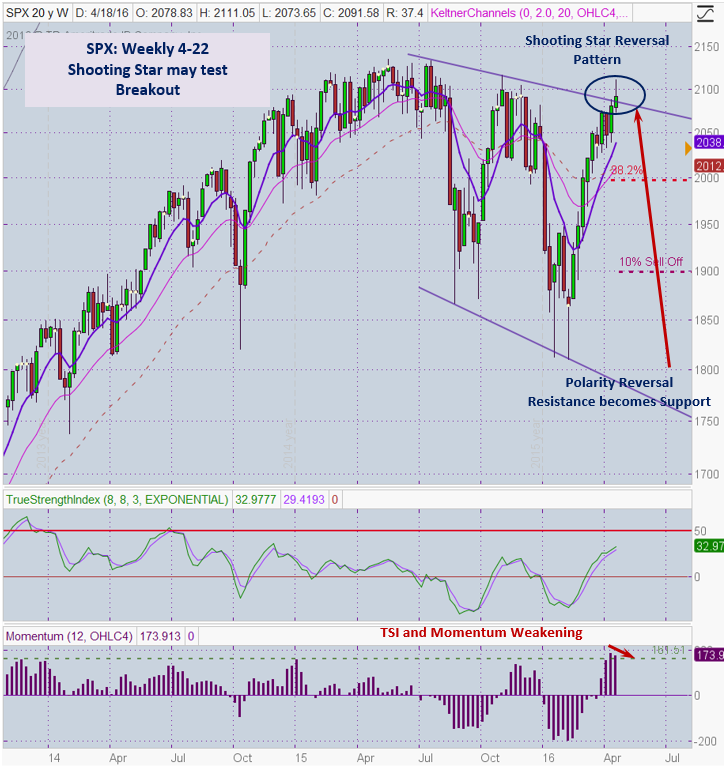
The weekly chart of SPX finished with a Shooting Star like pattern. This is a bearish reversal signal. Additionally the weekly Momentum showed its first pullback in about 10 weeks. Prices for the week tested up in to a strong level of resistance formed from last year’s highs but sellers or profit takers came from Wednesday to Friday to take a bit of the shine off the current uptrend. On the weekly chart below the negative divergence on the Momentum if visible. When negative divergence shows up it does not mean prices will not push higher it is simply a clue that the internals are starting to shift which might lead to a stronger pullback in the future. When? We shall see. The weekly chart also shows that price is extended from the moving averages so a reversion to the mean would not be a surprise. A retest at last week’s high or break below last week’s low may be the triggers for short term downside trades. A retest at the 2050 level or bouncing off the weekly moving averages would potentially be a set up to the long side.
SPX: Downside Market Short the SPY, SPY Puts or SPXU.
Preferred Long ETF’s: SPY, UPRO and SPXL
NDX: Downside Market Short the QQQ, QQQ Puts or SQQQ.
Preferred Long ETF’s: QQQ and TQQQ
RUT: Downside Market Short the IWM, IWM Puts or TZA.
Preferred Long ETF’s: IWM and TNA
The How to Make Money Trading Stock Show—Free Webinar every Friday at 11:30 a.m. PDT. I’m looking for the best time to offer this webinar. I want to try closer to the close on Friday to see how that works out for potential trades going into the close. This weekly live and recorded webinar helped traders find great stocks and ETF’s to trade with excellent timing and helped them stay out of the market during times of weakness.
How to Make Money Trading Stocks on Friday, April 29th
Register Here: https://attendee.gotowebinar.com/register/6304738586288150019
Note this session will be at: 11:30 a.m. PDT
To get notifications of the newly recorded and posted How to Make Money Trading Stocks every week subscribe at the Market Tech Talk Channel: https://www.youtube.com/channel/UCLK-GdCSCGTo5IN2hvuDP0w
– The Active Trend Trader Referral Affiliate Program is ready. For more information or to become an Affiliate please register here: https://activetrendtrading.com/affiliates-sign-up-and-login/
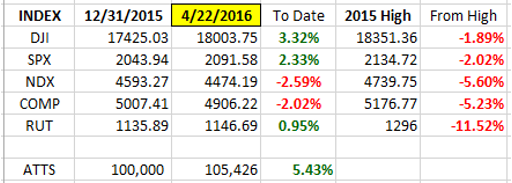
Index Returns YTD 2016
I’ve added a column to the Index YTD performance chart. The column on the far right shows the depth of the current correction with respect to the highs of the top from 2015. Note both DJI & SPX are now in positive territory for 2016.
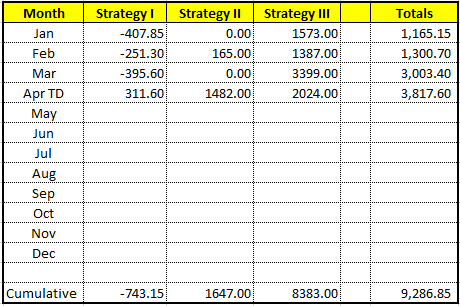
ATTS Returns for 2016 through April 22, 2016
Percent invested $100K account: Strategies I & II invested at 12.7%; Strategy III invested at 20%.
Current Strategy Performance YTD (Closed Trades)
Strategy I: Down -743.15 or -1.06%
Strategy II: Up $1647 or 16.47%
Strategy III: Up $8383.00 or +41.9%
Cumulative YTD: 9.28%
Active Trend Trading’s Yearly Objectives:
– Yearly Return of 40%
– 60% Winning Trades
– Early Warning Alert Target Yearly Return = 15% or better
For a complete view of specific trades closed visit the website at: https://activetrendtrading.com/current-positions/
Updated first full week of each month.
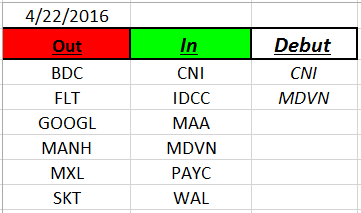
Outs & Ins: CNI & MDVN make their debut on this weekend’s IBD 50 list. Neither inductees are at a proper buy point as both are extended from both daily and weekly moving averages. About 90% of the stocks on the list have yet to report earnings this season so unless a traders is already long in one of these positions some may set up well for pre-earnings trades only.
Like the Indexes prices on most of the IBD 50 are pushing up against overhead supply which forms a resistance zone that must be breached before an uptrend can continue. Stocks of interest for this week include: TTC, FIVE & NVDA. Watch THO for a downside opportunity.
Share Your Success: Many of you have sent me notes regarding the success you are having with the Active Trend Trading System. Please send your stories to me at mailto:dww@activetrendtrading.comor leave a post on the website. Thanks.