Good Day Traders,
Overview & Highlights: Waiting on the Fed to report out on the 21st this week. We are moving quickly towards the end of September and while there have been some weakness prices have not fallen apart! This week we also have an installment from Mike Trager taking a macro look at what’s going on under the surface in the market. Mike hits some great points concerning the lack of a historical precedent for the eventual market to the high level of central bank action to stabilize economies and markets. Will it be different this time?
Secondly we are starting a new training series this Wednesday night. We will cover how to identify solid areas of horizontal support and resistance and how to strategically set up to trade these levels. This training will prepare us for the expected market bounce prior to the end of the year.
Webinars: At Active Trend Trading we offer two webinars per week to provide training plus trade and market updates. See the schedule below for the next webinars.
How to Make Money Trading Stocks on Friday, Sept 23rd
Register now for the next live webinar at the link below:
Register Here: https://attendee.gotowebinar.com/register/8594074630684155908
11:00 a.m. PDT
Next Training Webinar: Sept 21
For Premium Members our Wednesday evening training is developing some fantastic traders!
Topic: How to find Rock Solid Support and Resistance—Part 1
Managing Existing Trades: Positions open for 1 strategies.
Strategy I Portfolio Building: No Open Position
Strategy II Income Generation: No Open Position
For members wanting to better understand this Strategy there is a very good training video at: https://activetrendtrading.com/basic-option-strategy/
Strategy III Wealth & Income Generation Trades: Two Foundational Positions are in place to sell weekly options against. The recalculated weekly revenue needed from these foundational positions was forward in an update report earning last week. My objective with this Strategy is to collect enough weekly premium during the life of the LEAPS Strangle on both SPY and TSLA to both pay for the capital invested and gain between 50% – 100%. Closed the first TSLA LEAPS Strangle which was opened on 9/28/15 for a 100% profit on 9/2/16.
The closed half of the TSLA position was replaced with January 2018 LEAPS. This is a very volatile vehicle but if we get the timing correct my lead to a gain of 100% at an accelerated pace over the next 16 months. Details on the new positions are below.
Tip for Experienced Option Traders: Occasionally after a weekly trade goes against me but the trend appears to be changing I will add one naked contract over and above my foundation position and close this out after it gains at least half of the premium I’ve collected. Doing naked options is not for everyone and I keep my risk small by only doing one contract above my covered limit. In other words, if I can sell 4 contract covered by my long leaps I’ll sell one additional. This helps hedge the losses a bit but it this tactic is not without risk and must maintain a tighter stop than I would normally use with the regular position.
Note: We do our best to get both text alerts and email alerts out in a timely manner, occasionally there will be trades that are missed because of delay in the Text or Email alert applications. Additionally, please double check with your broker to assure they allow spread trades like we do with Strategy III. Some do and some don’t.
Additionally, it is crucial when selling premium against the Long LEAPS position that the premium collected cover the weekly cost of holding the LEAPS plus an additional amount to over this amount as a gain. This is one of the reason I sell premium of weekly options that are close to be “At The Money”. I base my selling on the expected move during the next week. If one is not bringing enough weekly premium this trade will not work out as well and may wind up being a losing trade.
Strategy III Weekly Results Week ending 9/16:
SPY: Profit of $0.00
TSLA: Profit of $189.00
Trade 1: Foundation Position is 4 contracts of SPY Jan17 205C and 4 contracts of SPY Jan17 200P Current Trade—Currently Up 20.29%; Premium Collected since opening trade on 1/4/16 = $6,396
Sold 2 contracts of SPY 23Sept 212.5P at 1.36; potential profit $544
Trade 2: (Long TSLA Jan17 250C & Long Jan17 220—Closed on 9/2 for 100% gain since 9/29) + New Positions Jan17 210C and 220P: Current Position Total Invested $14,900. Currently Up 81.6%: Premium Collected since opening trade on 9/28/15 = $15,688.50 + New Positions at $4,284.50 = Total Collected $19,973
Sold 1 contracts of SPY 23Sept 207.5C at 2.44; potential profit $244
Trade 3: Long NUGT Jan18 18.4C + NUGT Jan18 18.4P. 4 contracts each side of the straddle for total investment of $6,720. The required weekly premium to collect each week to achieve a 100% return by Jan 2018 is $191.43 per week.
Sold 2 contracts of NUGT 23Sept 16P at 0.90; potential profit $180
Sold 2 contracts of NUGT 23Sept 21.5C at 0.50; potential profit $100
I will wait for appropriate set ups for the remaining available NUGT LEAPS.
Several members have asked about this strategy and a more detailed explanation is available at: https://activetrendtrading.com/wealth-and-income-strategy/
I posted a video about how to choose the weekly options to short for this strategy. It can be viewed at: https://activetrendtrading.com/videos/
Additionally, some of these trade may be selling weekly puts on up trending stocks. If you are interested in parallel trading this strategy register at this link: http://forms.aweber.com/form/99/1278533099.htm
Potential Set Ups for this week: My objective is two-fold this week. Watch and see what the Fed does about interest rates first and secondly identify both stocks and ETF’s that will benefit from an end-of-year seasonal run. I will need a very compelling setup to enter a trade prior to the Fed announcement on September 21st. After this meeting there will be two more in 2016. The Fed meetings have become somewhat non-eventful with the Fed speak prior to and after the meeting moving the indexes more than the actual event. As soon as we treat the Fed meeting without due respect will be the time the announcement takes us out at the knees.
Pre-Earnings Trade: CTAS reports earnings on 9/29 AMC and may be setting up for a pre-earning’s run.
Pre-earnings trades can be a great supplement to the portfolio building portion of Strategy I. Depending on the stock and technical analysis they tend to be predictable and repeatable. For busy traders focusing on pre-earning opportunities can free one up from the necessity of constantly chasing stocks during other periods of the year. The process repeats four times a year and capturing a 5%-15% return four times a year can compound very nicely!
Upside: SSTK, ACIA, ELLI, JUNO & TSLA
Downside: None for this weekend.
On the Radar: Stocks & ETFs that could go either way include: UPRO, SPXU, TQQQ, SQQQ, TNA, TZA & their associated non-leveraged Index ETFs. NUGT, SSTK, ALGN, IPHI, ELLI, ACIA, ABMD, CHFC, COR, JUNO, NFLX, INCY & TSLA.
Stocks identified by ** that are close to a potential entry point.
Early Warning Alerts for Leveraged Index ETFs: Last Trigger: 9/14, Buy Order issued on 9/15.
EWA Account Return to date: 5.5%
The Early Warning Alert Service hit all eight major market trading points in 2015. See this brief update video for more details: Early Warning Alerts Update Video or at https://youtu.be/GJwXCL4Sjl4
If simplifying your life by trading along with us using the index ETF is of interest, you can get the full background video at: https://activetrendtrading.com/etf-early-warning-alerts-video/
Mike’s Macro Market Musings: Secular Bulls and Bears, Oh My!
I have written and spoken before of secular bull and bear markets but haven’t done so for a while and was reminded of this when I recently saw the chart reproduced below. I personally find the subject matter of secular markets and secular cycles really interesting, but that’s me. Many find this subject completely hypothetical and irrelevant since it requires a very, very long term perspective and has little to do with market timing or finding that next income producing swing trade utilizing daily or intraday charts. Admittedly, the very long term nature of these market cycles necessarily means that there is a very small sample size of precedents for historical comparison in the U.S equity markets and this small sample size may very well compromise the forecasting implications that some might want to project based on past cycles. Given these shortcomings, though, here I go. By the way, space limitations here will make this discussion necessarily brief. Whole volumes and books have been dedicated to this subject should one desire more complete information.
Secular market cycles are very long term market cycles that can average approximately 18 years in duration (and this is a very loose approximation). Secular bull and secular bear markets have very distinct characteristics that differentiate them from each other. There is currently some ongoing debate as to whether we have been and still are in a secular bear market dating back to the market peaks of 2000 at the height of the dot com silliness, or whether we experienced an abbreviated secular bear market that began in 2000 and ended at the market trough in 2009 and have been in a new secular bull market since then. There are seemingly valid arguments that could be made to support either scenario. The most recent comparison for a secular bull market is the period from 1982-2000 and the most recent secular bear market seems to be the period from around 1966-1982; one might find Warren Buffet’s termination of his original investment partnership in 1966-1968 an interesting observation.
Some of the differentiating factors between secular bull and bear markets utilize valuation extremes (this kind of ties into my recent observations about current valuations in U.S. equity markets) and economic expansion and recession cycles. Secular bulls are thought to end when markets realize extreme overvaluations and secular bears are believed to end when extreme undervaluations are achieved, meaning single digit P/E ratios on the S&P 500. For purposes of this discussion I will refer to the Shiller P/E ratio, a metric that is smoothed out over a 10-year period and thus doesn’t fluctuate very sharply. The following chart will provide some visual demonstration of these correlations going back over 100 years to 1900:
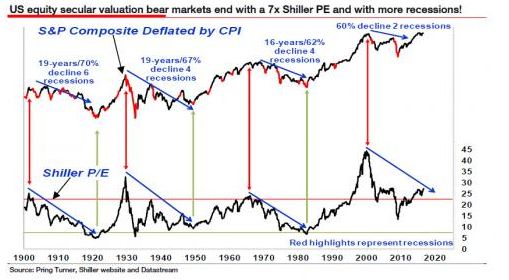
To summarize the above chart, secular bear markets usually begin when valuations have reached extreme overbought levels (see the vertical red lines in the above chart) and usually don’t end until the Shiller P/E goes into single digit territory (generally in the ballpark of 6-8; see the vertical green lines in the above chart) and there have been four or more recessions, at least according to the article from which this graphic has been copied. Since the dot com peak in 2000, we have experienced 2 formally recognized recessions and, at the market trough in March, 2009, realized a Shiller P/E measure of around 13-14, most certainly not the extreme single digit reading seen at past secular bear bottoms.
How might we extrapolate from this going forward? If we accept the above reasoning (which you may or may not), we might surmise that the secular bear market starting at the valuation peak in 2000 has not yet bottomed and played itself out and won’t do so until and unless the U.S. economy goes through a couple of more recessions and the Shiller P/E drops dramatically from the current extreme reading of approximately 26-27. If history repeats itself and the Shiller P/E goes down to a single digit reading of, say, 8, and we apply that to current trailing 12 months S&P 500 earnings of $86-87/share, we generate a long term downside target for the S&P 500 of somewhere around 690-700, creating a double bottom of sorts on long term monthly and quarterly charts of SPX compared to the low of 666 in March, 2009. It has happened before and certainly could possibly happen again. And this is assuming that current S&P 500 earnings hold at their current level through the coming recessions – I believe it should be a given that they will not do so, earnings decline during recessions, we just don’t yet know from what level that decline will occur and how far the earnings decline might be.
Is it different this time? Some think so, especially given the extreme interventions in the financial markets of global central banks the past few years. However, the unintended consequences of said interventions cannot be known at this time since there is no historical precedent from which to draw conclusions and it is certainly equally possible that the consequences may prove to be more extreme than we can currently imagine.
What we can know, based on the above information, is this – should any of the above projections be realized at some point in time, if SPX were to actually decline to anywhere near the 700 area with a single digit Shiller P/E as a result of one or more recessions to come, it will present a once in a generation buying opportunity marking the end of a secular bear market and the beginning of the next secular bull market which could last 10-20 years and in which multiyear buy and hold investing strategies work extraordinarily well, the period from 1982-2000 being the best and most recent example. While none of this speaks to market timing during the coming days and weeks and months, I believe it is useful long term information to keep in the back of our minds so we can be prepared to act, and act in a very big way, if and when that time comes.
General Market Observation: “Standby to standby” as we wait for the Fed announcement on Wednesday the 21st. There are many opinions out there regarding what’s happening in the economy, which presidential candidate will be best for the stock market and what will the impacts of global economic sluggishness. None of these has provided a last catalyst to propel the Indexes in either direction. The economic reports out last Friday provided no clarity regarding a direction for the Fed to move concerning a rate hike. Some the Fed Presidents are hawkish while others lobby for a more cautious approach. One thing that concerns me in the long haul is that it seems the Fed is making more and more decisions using short range data points like month employment or productivity reports. When organizations are focused with such near-sightedness they may miss the longer term unintended consequences of their decisions. These short term decisions start piling up until inertia and gravity take over.
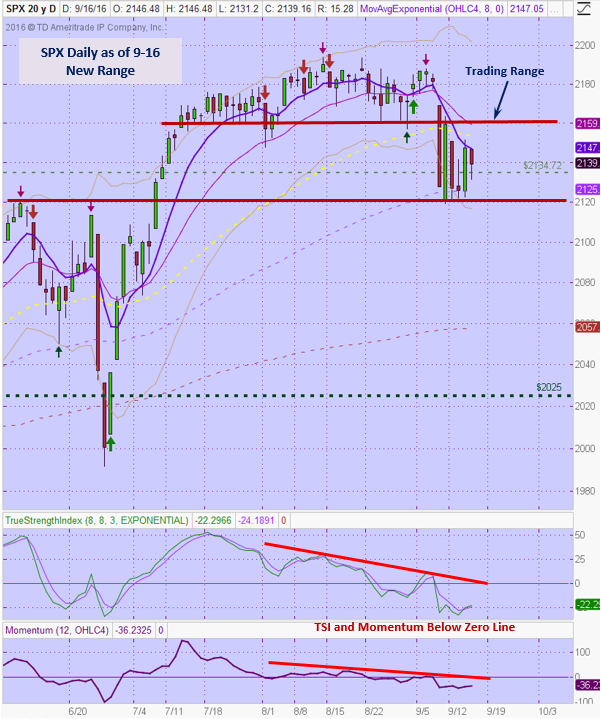
Each of the three Tracking Indexes performed differently this past week. The SPX and RUT moved with less momentum than the NDX. Each however has provided a new lower support area as priced vacillated during the week. The SPX is moving within a new trading zone from 2160 down to the 2120 level. Price action spend the last four days of the week below the 50 day EMA. Trades on this index’s ETFs should be planned around the support and resistance areas up until the Fed announcement. After the announcement new levels of support and resistance may be defined.
The RUT did finish above the 50 day EMA but below the 8/20 EMA area. This index or it’s surrogates would potentially move most regardless of the Fed’s decision. Current price action is working between the 1200 and 1230 levels.
NDX outperformed last week returning almost to past highs. The Nasdaq 100 price action most resembled the power of past moves after a brief and shallow selloff. Prices closed back above all moving averages just below resistance at 4837.
SPX: Downside Market Short the SPY, SPY Puts or SPXU.
Preferred Long ETF’s: SPY, UPRO and SPXL
NDX: Downside Market Short the QQQ, QQQ Puts or SQQQ.
Preferred Long ETF’s: QQQ and TQQQ
RUT: Downside Market Short the IWM, IWM Puts or TZA.
Preferred Long ETF’s: IWM and TNA
The How to Make Money Trading Stock Show—Free Webinar every Friday at 11:00 a.m. PDT. This weekly live and recorded webinar helped traders find great stocks and ETF’s to trade with excellent timing and helped them stay out of the market during times of weakness.
How to Make Money Trading Stocks on Friday, Sept 23rd
Register now for the next live webinar at the link below:
Register Here: https://attendee.gotowebinar.com/register/8594074630684155908
11:00 a.m. PDT
To get notifications of the newly recorded and posted How to Make Money Trading Stocks every week subscribe at the Market Tech Talk Channel: https://www.youtube.com/c/MarketTechTalk
– The Active Trend Trader Referral Affiliate Program is ready. For more information or to become an Affiliate please register here: https://activetrendtrading.com/affiliates-sign-up-and-login/
Index Returns YTD 2016
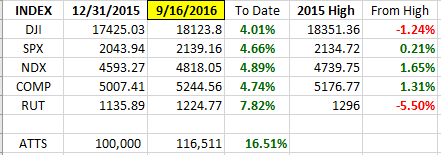
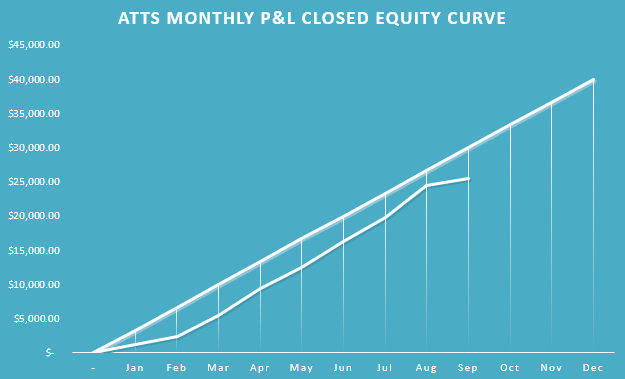
ATTS Returns for 2016 through Sept 16, 2016
Percent invested initial $100K account: Strategies I & II invested at 0.0%; Strategy III invested at 15%.
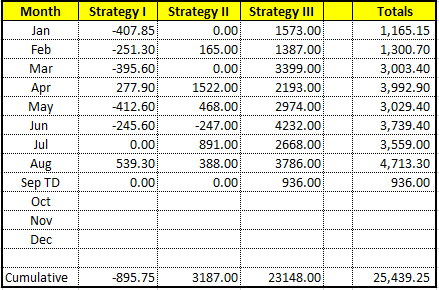
Current Strategy Performance YTD (Closed Trades)
Strategy I: Down -895.75 or -1.27%
Strategy II: Up $3187.00 or +3.18%
Strategy III: Up $22028 or +89.9%
Cumulative YTD: 25.4%
Outs & Ins: BIIB & SHPG were added to the IBD 50 this weekend. BIIB is in a consolidation pattern and SHPG is early in an upside move. BIIB looks to be an interesting candidate and provide monthly and weekly option chains for those who might want to trade an option strategy.
I’m not in a hurry to jump into any stock prior to the Fed meeting without a very compelling setup. I’ll be watching SSTK, ALGN, IPHI, ACIA**, ABMD, CHFC**, COR and ELLI this week for support bounces. CTAS reports earnings on 9/29 AMC.

Share Your Success: Many of you have sent me notes regarding the success you are having with the Active Trend Trading System. Please send your stories to me at dww@activetrendtrading.com or leave a post on the website. Thanks.