Good Day Traders,
Overview & Highlights: Don’t miss Mike’s Macro Market Musing in this Trader’s Report. He covers the Hindenburg Omen which tends to lead major market downsides. The latest of these signals fired off in June of this year. Will it be different this time? We shall see!
Webinars: At Active Trend Trading we offer two webinars per week to provide training plus trade and market updates. See the schedule below for the next webinars.
How to Make Money Trading Stocks on Friday, July 15th
Register Here: https://attendee.gotowebinar.com/register/5314489828718176772
New Time—11:00 a.m. PDT
Next Training Webinar: July 13th
For Premium Members our Wednesday evening training is developing some fantastic traders!
Mid-Week Market Sanity Check Topic: Is it Me? Trading Psychology
Managing Existing Trades: Positions open for 2 strategies.
Strategy I Portfolio Building: No Open Positions
Strategy II Income Generation:
Weekly Profit
GLD closed first ½ of 12 contract position: Profit Total of $786 on ½ of the position
Trade 1: GLD 19Aug 122/127C Debit Spread bought for $1.49 as a seasonal trade on Gold
Sold ¼ of 12 positions at $250 for a profit of $303.
Sold second ¼ of 12 contract position on 7/1 at 3.10 profit = $483
Sell last ½ at $4.00 and $4.50 if price moves quickly.
For members wanting to better understand this Strategy there is a very good training video at: https://activetrendtrading.com/basic-option-strategy/
Strategy III Wealth & Income Generation Trades: Two Foundational Positions are in place to sell weekly options against. The recalculated weekly revenue needed from these foundational positions was forward in an update report earning last week. My objective with this Strategy is to collect enough weekly premium during the life of the LEAPS Strangle on both SPY and TSLA to both pay for the capital invested and gain between 50% – 100%.
Tip for Experienced Option Traders: Occasionally after a weekly trade goes against me but the trend appears to be changing I will add one naked contract over and above my foundation position and close this out after it gains at least half of the premium I’ve collected. Doing naked options is not for everyone and I keep my risk small by only doing one contract above my covered limit. In other words, if I can sell 4 contract covered by my long leaps I’ll sell one additional. This helps hedge the losses a bit but it this tactic is not without risk and must maintain a tighter stop than I would normally use with the regular position.
Note: We do our best to get both text alerts and email alerts out in a timely manner, occasionally there will be trades that are missed because of delay in the Text or Email alert applications. Additionally, please double check with your broker to assure they allow spread trades like we do with Strategy III. Some do and some don’t.
Additionally, it is crucial when selling premium against the Long LEAPS position that the premium collected cover the weekly cost of holding the LEAPS plus an additional amount to over this amount as a gain. This is one of the reason I sell premium of weekly options that are close to be “At The Money”. I base my selling on the expected move during the next week. If one is not bringing enough weekly premium this trade will not work out as well and may wind up being a losing trade.
Strategy III Weekly Results Week ending 7/8:
SPY: Profit = $24
TSLA: Profit = $278
Trade 1: Foundation Position is 4 contracts of SPY Jan17 205C and 4 contracts of SPY Jan17 200P Current Trade—Currently Up 17.85%; Premium Collected since opening trade on 1/4/16 = $5314
Sold 4 contracts of SPY 15Jul 212C at 1.36 —Potential Profit $544
Trade 2: Long TSLA Jan17 250C & Long Jan17 220 + New Positions Jan17 210C and 220P: Current Position Total Invested $14,900
Currently Up 53.52%: Premium Collected since opening trade on 9/28/15 = $12,723.50 + New Positions at $1,243.50 = Total Collected $13,967
Sold 2 contracts of TSLA 15Jul 217.5C at 3.60 — Potential Profit $720
Stopped at 8.50 = Loss of $980
Several members have asked about this strategy and a more detailed explanation is available at: https://activetrendtrading.com/wealth-and-income-strategy/
I posted a video about how to choose the weekly options to short for this strategy. It can be viewed at: https://activetrendtrading.com/videos/
Additionally, some of these trade may be selling weekly puts on up trending stocks. If you are interested in parallel trading this strategy register at this link: http://forms.aweber.com/form/99/1278533099.htm
Potential Set Ups for this week: Like the Indexes many growth stocks moved quickly off their lows and are now extended. If the strength continues I will look to trade pullbacks to appropriate buy trigger points around the 8/20/50 day moving averages.
Still valid: One observation over the past few weeks is that many stocks are showing ‘V’ bottoms. This type of bottom tends to be weak and can provide some violent correction once the momentum starts running out. Because of this we need to adjust expectations for returns on individual trades to smaller profit targets and tight stops. 5% – 15% are great objectives for initial targets and if hit setting breakeven stop losses is prudent.
Pre-Earnings Trade: In the next 4 weeks some of my favorites will report earnings. These include: TSLA (8/3), FB (7/27), AMZN (7/28), GOOGL (7/28), NFLX (7/18) and BIDU (7/28). Buy shares of these stocks can be expensive but buying an out of the money call option and then selling premium against it over the next few weeks and letting Implied Volatility increases the value of the long option can be very rewarding. I’ll look for an appropriate trade set up then treat it like a Strategy II & III trade. Look for an alert on TSLA when it pulls back to its 8/20 day moving averages for a potential entry.
Pre-earnings trades can be a great supplement to the portfolio building portion of Strategy I. Depending on the stock and technical analysis they tend to be predictable and repeatable. For busy traders focusing on pre-earning opportunities can free one up from the necessity of constantly chasing stocks during other periods of the year. The process repeats four times a year and capturing a 5%-15% return four times a year can compound very nicely!
Upside: Waiting for pullbacks on the Index ETF’s, BIDU (pre-earnings) and TSLA.
Downside: EW, WBMD, UBNT, ANET & WYNN
On the Radar: Stocks & ETFs that could go either way include: UPRO, SPXU, TQQQ, SQQQ, TNA, TZA & their associated non-leveraged Index ETFs. TSLA (Currently in downtrend channel), NFLX, BIDU, CME, WYNN, PAYC, WOR, XRS, MBLY, AMBA, PYPL & NTES
Stocks identified by ** that are close to a potential entry point.
Early Warning Alerts for Leveraged Index ETFs: Standby Alert issued on 6/27.
EWA Account Return to date: 5.5%
New Video Update will be posted in July.
The Early Warning Alert Service hit all eight major market trading points in 2015. See this brief update video for more details: Early Warning Alerts Update Video or at https://youtu.be/GJwXCL4Sjl4
If simplifying your life by trading along with us using the index ETF is of interest, you can get the full background video at: https://activetrendtrading.com/etf-early-warning-alerts-video/
Mike’s Macro Market Musings: Hindenburg Omen – Going Down in Flames?

The Hindenburg Omen is a technical indicator named after the famous crash of the German airship of the late 1930s (one can Google “Hindenburg” for more information on that particular reference if one wonders why that name has been chosen for a set up in equity market indexes with negative connotations; the photo above should provide a clue). The Hindenburg Omen was developed to predict the potential for a financial market crash. It is created by monitoring the number of securities that form new 52-week highs relative to the number of securities that form new 52-week lows on any given day – the number of securities must be abnormally large for both metrics. These criteria are deemed to be met when both numbers are greater than 2.2% of the total number of issues that trade on the NYSE for that specific day. Traders use an abnormally high number of 52-week highs/lows because it suggests that market participants are starting to become unsure of the market’s future direction and therefore could be due for a major correction. Proponents of this indicator argue that it has been very accurate in predicting sharp sell-offs in the past and that there are few indicators that can predict a market crash as accurately. Like any other indicator, it is not perfect or 100% predictive. There are times, however, when it can pay to heed the warning signal it provides, especially when certain variations are applied to it.
One of those variations is to substitute for the 2.2% number mentioned above an easier to monitor fixed number of 100; that is, days with at least 100 NYSE new highs and 100 NYSE new lows. Historically, what happens following instances when there are at least 100 new highs and 100 new lows for the day in the NYSE? Since the NYSE index currently represents approximately 3300 individual stocks, this 100 number is about 3% of that, therefore a slightly more rigorous standard than the aforementioned 2.2%. Let’s take a look:
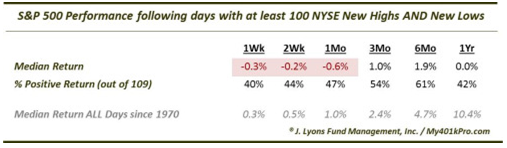
The table above is derived from data accumulated from the 110 instances that have occurred since 1995. All in all, we can see that since 1995 the market tends to not do very well for time frames ranging from one week to one year after each occurrence, although there also doesn’t appear to be a catastrophic consequence either. Therefore, we can understand the skepticism with which some regard this particular variation of this indicator, and the indicator in general.
Let’s throw another ingredient into the mix and see what happens. Of the 110 instances of this variation of the Hindenburg Omen since 1995, there have been 18 occurrences when the Omen set up occurred within two weeks of the S&P 500 having put in a 3-month low, the most recent of these having occurred on June 27, 2016, immediately following the 2 day Brexit sell off in the markets, and July 15, 2015. What implication for future market price action might this set up portend?
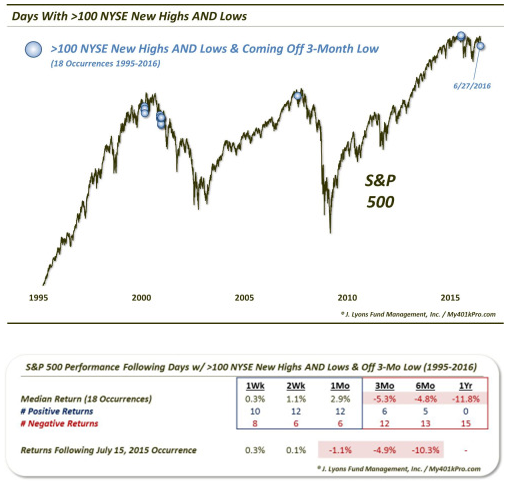
In the very short term, this data (admittedly a small statistical sample size) supports the logical anticipated “dead cat” or reflex bounce one might anticipate but also shows the consistent intermediate to longer term negative consequences over time frames ranging from 3 months to one year. We cannot yet know what the one year follow up will be after the 2 most recent set ups seen on July 15, 2015, and June 27, 2016, but we do know what happened after the previous 16 occurrences.
Yes, it is a small sample size, however 1 year after these 16 events, the S&P 500 was lower every single time, by a median -11.8%. Furthermore, it is not shown on the table, but 2 years after the events, the S&P 500 was lower every single time as well, with a median return of -30.8% and a median drawdown of -40.5%. By now, you’ve likely figured out approximately when these days occurred. Specifically, 5 occurred in March 2000, 9 in November-December 2000 and 1 in August 2007. And now, June 27, 2016. Whether statistically significant or not, and for what it’s worth, the stats are what they are.
Will it be different this time? Time will tell. What is different this time, however, is the extraordinary and unprecedented intervention into the financial markets by the global central banks, potentially rendering any historical precedents based on fundamentals and/or technicals moot and invalid. Thus, while the central banks may well be capable of preventing, or at least delaying, history from repeating itself, there is a proven tendency for history to eventually at least rhyme with itself.
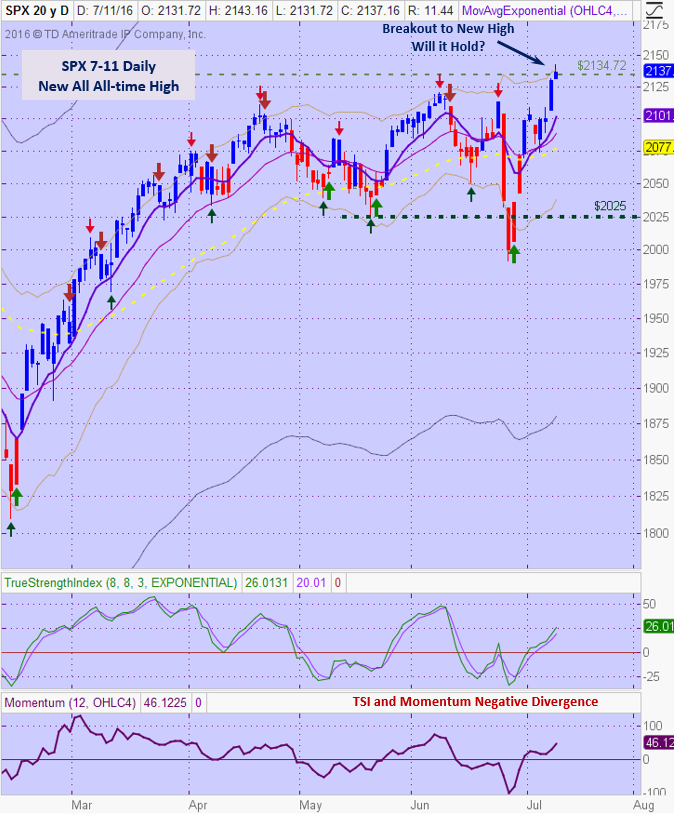
General Market Observation: Glad I let today’s price action playout in the Indexes to finish the Trader’s report. Today’s price action on the SPX officially set a new all-time high. Price action gapped up from Friday’s close and pushed through resistance at the old high. Price action then reversed midday and closed with an upper shadow or wick on today’s candlestick. A new high has been achieved now what? The move up from last Wednesday has been almost straight up so digesting these gains would seem reasonable. Price action also closed at the upper Keltner Channel. Should a pullback be expected and if so how severe? Should we short the high and hope for a tradable pullback? Like trying to catch the absolute low when stocks fall trying to time the absolute high is also a fool’s errand. If on the other hand, we do get a retest of today’s highs and secondary failure this would constitute a downside entry. To the upside, I will not buy the Indexes since it is well extended from the mean of both the 8 day and 20 day EMA’s. The old adage of trade the pullbacks until they stop working is apropos recent price action. To get some idea of where prices may pullback to lay in a Fibonacci Retracement from the low on 6/27 to today’s high. A retracement to the 38.2% level would put prices at the 8/20 day moving averages. A drop to the 50% level would coincide with the 50 day EMA. Either could provide levels to bounce from.
What about the Summer Doldrums? As mentioned previously 7 out of the past 10 years have resulted in weak July-August trade periods. While the probabilities favor a similar course this year could side with the 30% of years that have been positive. Going forward there are many uncertainties. It is forecast that earnings and growth for SPX stocks will go down again this earnings season. This will make multiple quarters of positive but falling earnings. If another drop materializes how will the market react? BREXIT is no longer an issue for the market until the EU and Britain start working out the details. As we’ve seen the BREXIT selloff turned out to be a minor blip on the screen! Weakening global economies may pose risk through the rest of the year, but the US markets may stay strong due to the shift in foreign funds to the US Indexes. Regardless this summer will provide many opportunities and our objective is to stay on the correct side of the trade!
The NDX came within a whisper of this year’s high and busted out of the top of the Keltner Channel on a daily chart. This typically can be interpreted as positive but like the SPX there is a hint of negative divergence on both the TSI and Momentum oscillators. Remember price can continue to push higher even if there is negative divergence. Just file this away as a potential clue for the near future. The RUT has made another round trip from between 1085 and 1190. The daily chart has similar characteristics to the NDX and SPX regarding negative divergence.
With each of the three Tracking Indexes sitting at the top of the Keltner Channel look for either weakness or continued strength.
SPX: Downside Market Short the SPY, SPY Puts or SPXU.
Preferred Long ETF’s: SPY, UPRO and SPXL
NDX: Downside Market Short the QQQ, QQQ Puts or SQQQ.
Preferred Long ETF’s: QQQ and TQQQ
RUT: Downside Market Short the IWM, IWM Puts or TZA.
Preferred Long ETF’s: IWM and TNA
The How to Make Money Trading Stock Show—Note time change. This change will allow a full hour after the webinar to adjust trades. Free Webinar every Friday at 11:00 a.m. PDT. I’m looking for the best time to offer this webinar. I want to try closer to the close on Friday to see how that works out for potential trades going into the close. This weekly live and recorded webinar helped traders find great stocks and ETF’s to trade with excellent timing and helped them stay out of the market during times of weakness.
How to Make Money Trading Stocks on Friday, July 15th
Register Here: https://attendee.gotowebinar.com/register/5314489828718176772
New Time—11:00 a.m. PDT
To get notifications of the newly recorded and posted How to Make Money Trading Stocks every week subscribe at the Market Tech Talk Channel: https://www.youtube.com/c/MarketTechTalk
– The Active Trend Trader Referral Affiliate Program is ready. For more information or to become an Affiliate please register here: https://activetrendtrading.com/affiliates-sign-up-and-login/
Index Returns YTD 2016
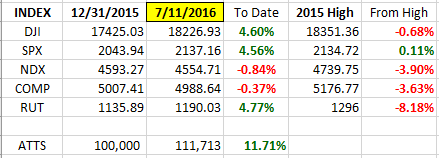
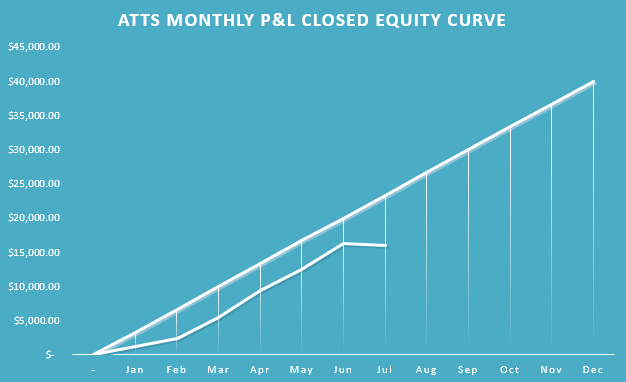
ATTS Returns for 2016 through July 11, 2016
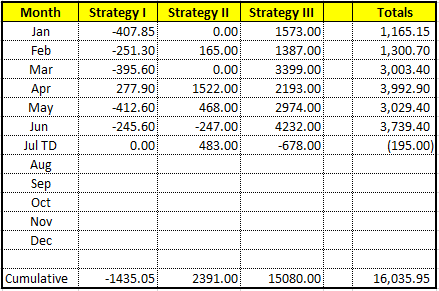
Percent invested initial $100K account: Strategies I & II invested at 7.7%; Strategy III invested at 25.98%.
Current Strategy Performance YTD (Closed Trades)
Strategy I: Down -1435.05 or -2.05%
Strategy II: Up $2391.00 or +23.91%
Strategy III: Up $15758 or +58.15%
Cumulative YTD: 16.0%
Active Trend Trading’s Yearly Objectives:
– Yearly Return of 40%
– 60% Winning Trades
– Early Warning Alert Target Yearly Return = 15% or better
For a complete view of specific trades closed visit the website at: https://activetrendtrading.com/current-positions/
Updated first full week of each month. The next update August
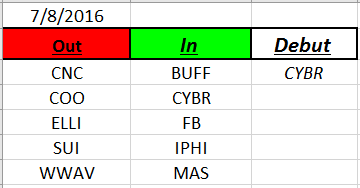
Outs & Ins: CYBR makes its debut on the IBD 50 this year. This stock has been on the list in past years. CYBR has just moved out of a long downtrend which looks promising. Look for pullbacks to the 8/20 day EMA’s for a potential entry if the Indexes stay strong.
Earning reports on the IBD 50 stocks will increase over the next few weeks. There may be some good pre-earnings setups but like the Indexes many of the IBD 50 stocks need to pullback for potential entries.
Share Your Success: Many of you have sent me notes regarding the success you are having with the Active Trend Trading System. Please send your stories to me at mailto:dww@activetrendtrading.comor leave a post on the website. Thanks.