Good Day Traders,
Overview & Highlights: Momentum appears to be waning on the Indexes. Will this lead to a quick pullback or more? We shall see.
I hope all members have seen some of the live Facebook broadcast. If you want notification of when these live market updates take place, please follow Active Trend Trading at: https://www.facebook.com/ActiveTrendTrading/
Upcoming Webinars: At Active Trend Trading we offer three webinars per week to provide training plus trade and market updates. See the schedule below for the next webinars.
The How to Make Money Trading Stock Show—Free Webinar every Friday at 11:00 a.m. PDT. This weekly live and recorded webinar helped traders find great stocks and ETF’s to trade with excellent timing and helped them stay out of the market during times of weakness.
How to Make Money Trading Stocks on Friday, March 10th
Register now for the next live webinar at the link below:
Register Here: https://attendee.gotowebinar.com/register/385843200414302723
Time 11:00 a.m. PDT
Next Training Webinar: March 8th
For Premium Members, our Wednesday evening training is developing some fantastic traders
Topic: Early Warning Updates
** Friday’s “Final Hour”: March 10th **
Time 12:00 p.m. PDT
For Premium Members, provides trades and set ups during the final hour of weekly trading.
Managing Current Trades: Full Position in ESNT
ESNT Opened on 3/2 & 3/3 for average cost of 35.20
SL = 34.50 (Swing Low)
T1 = 36.97
T2 = 42.25 of 8 day EMA Rule
Strategy II Basic Options: No Open Positions
For members wanting to better understand this Strategy there is a very good training video at: https://activetrendtrading.com/basic-option-strategy/
Strategy III Wealth & Income: Foundation positions are open in SPY, TSLA and NUGT. Total capital for Strategy III = 30% or $26.6K.
SPY: Waiting for setup at the upper or lower Keltner Channel on the weekly chart
TSLA: Waiting for setup at the upper or lower Keltner Channel on the weekly chart
NUGT: Waiting for setup at the upper or lower Keltner Channel on the weekly chart
Results from last week:
SPY: Profit = 0.00
TSLA: Profit = $466
NUGT: Loss = $268
Running Performance premium collected plus residual value of LEAPS
SPY: +12.35%
TSLA: +20.85%
NUGT: +8.34%
Combined: 15.88%
Tip for Experienced Option Traders: Occasionally after a weekly trade goes against me but the trend appears to be changing I will add one naked contract over and above my foundation position and close this out after it gains at least half of the premium I’ve collected. Doing naked options is not for everyone and I keep my risk small by only doing one contract above my covered limit. In other words, if I can sell 4 contract covered by my long leaps I’ll sell one additional. This helps hedge the losses a bit but it this tactic is not without risk and must maintain a tighter stop than I would normally use with the regular position.
Note: We do our best to get both text alerts and email alerts out in a timely manner, occasionally there will be trades that are missed because of delay in the Text or Email alert applications. Additionally, please double check with your broker to assure they allow spread trades like we do with Strategy III. Some do and some don’t.
Additionally, it is crucial when selling premium against the Long LEAPS position that the premium collected cover the weekly cost of holding the LEAPS plus an additional amount to over this amount as a gain. This is one of the reason I sell premium of weekly options that are close to be “At the Money”. I base my selling on the expected move during the next week. If one is not bringing enough weekly premium this trade will not work out as well and may wind up being a losing trade.
Several members have asked about this strategy and a more detailed explanation is available in this updated video at: https://activetrendtrading.com/wealth-and-income-strategy/
I posted a video about how to choose the weekly options too short for this strategy. It can be viewed at: https://activetrendtrading.com/videos/
Additionally, some of these trades may be selling weekly puts on up trending stocks. If you are interested in parallel trading this strategy register at this link: http://forms.aweber.com/form/99/1278533099.htm
Early Warning Alerts for Leveraged Index ETFs: Last Trigger: 11/4—Waiting new signal or secondary trigger.
EWA Account Return for 2017: 0.09%
The Early Warning Alert Service alerted on all market lows in 2016. See the link below for the new video for 2016 that highlights entry refinements that will provide improved entries even in environment like 2016. In 2016 the entry triggers were challenging because of the number of straight off the bottom moves. Mike and I have analyzed this and have tested adjustments in place going forward.
EWA 2016 Update Video: https://activetrendtrading.com/early-warning-alerts-update-for-2016/
Potential Set Ups for this week: With the Indexes letting air out of the balloon most stocks on the Premium Watch List are doing the same thing. Both ESNT and AMAT floated to the top of the Fundamentally strong stocks sort of the IBD 50. NVDA remains on the radar and may set up if the Indexes strengthen. NVDA displays strong support at the 95.30 level.
GOLD Miners: NUGT and DUST are the two leveraged ETFs we follow. These emulate non-leverage ETF GDX. If the dollar weakens expect a bounce in NUGT. I would expect this to be a limited but volatile bounce. Remember these ETFs run 10%-20%+ very quickly. Looking forward to the potential run in gold in the June-July timeframe.
Financials: FAS is in an uptrend matching XLF. Currently pulling back with negative divergence showing on the weekly charts. Seasonally time is entering a period which tends to be bullish for Financials.
Biotech’s: IBB is in a short-term uptrend and is rejecting resistance. Bio’s tend to top in late February. Which may provide a trade in LABD. LABD is perfect example of the challenge of trading the inverse leveraged ETFs. This is due to backwardation and contango. To trade with some confidence, watch for shorting set ups on IBB and then trade into LABD. In the case of IBB look for a break below the short-term trend line connecting the lows of 1/31 and 2/23.
Oil: Even though in a slump for several years’ crude oil tends to rally after lows in February. At this point USO the non-leveraged ETF for oil is stuck in a tight price range. UCO is stuck in a similar range of 10%. March is mostly an up month for oil, so look for a potential by in UCO between the 20.60 and 21.00 levels. Neither TSI or Momentum are trending!
Indexes: Covered in General Market Observations
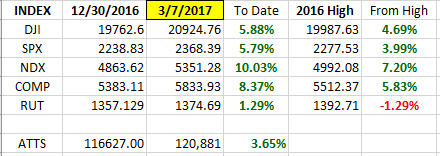
General Market Observation: How strong will the current pullback be? The last thrust on all three of the Tracking Indexes broke out to new highs. What next? Recognize the uptrend is still intact so until they stop working look for a trade coming out of the pullback. My focus will be on the Russell, but if SPX or NDX rebounds more quickly the leveraged ETFs for these indexes may be the trade. The probabilities are in favor of a positive year for the Indexes due to both January and February being positive. Going back to 1950, 24 out of 26 years provided positive yearly results when the first two months of the year were up. This conflicts with the expectations of a Post-Election year seasonality, but this past election was far from our average election. Could it be true that there is a bound-up momentum which could be unleashed because of lower taxes and fewer regulations? We shall see!
The SPX chart below shows a ceiling at 2400 and a floor at the 2354 level. Today’s close below the 8 day EMA increases the probability that the 20 day EMA or 2354 being tested. March tends to be an up month so a pullback into a buy zone may take place and then a sideways move until the October/November timeframe. In my study of the small cap stocks, many catch a bid in March through April. This may be partly due to funds entering retirement accounts to beat tax season restrictions. Regardless the reason, I’ll be watching the levels identified for potential trade entries on the UPRO, TQQQ or TNA.
NDX showing a personality like the SPX. If the current pullback results in a bounce, the health of the current uptrend will be revealed by the character and strength of the bounce. If the bounce is weak and fails to move back up and through resistance, then a temporary top may be in place. This could lead to either a more significant pullback or a range bound sideways trend. A hiccup in tax reform and other legislation resulting in pushing these actions into 2018 the Indexes could react violently. The other unknown is rate hikes. Too fast and the rally will react negatively.
The Russell is rapidly approaching support at the 50 day EMA. The 50 has held over the past 4 months. If it fails at this there is support between the 1340 and 1350 levels. Both TSI & Momentum has fallen below the “zero” line on the daily chart. Both oscillators are pointed down and accelerating. The RUT often leads the other indexes and can be more volatile. It is currently the weakest Index. If the 50 day fails, look for support at the support zone highlighted above.

SPX: Downside Market Short the SPY, SPY Puts or SPXU.
Preferred Long ETF’s: SPY, UPRO and SPXL
NDX: Downside Market Short the QQQ, QQQ Puts or SQQQ.
Preferred Long ETF’s: QQQ and TQQQ
RUT: Downside Market Short the IWM, IWM Puts or TZA.
Preferred Long ETF’s: IWM and TNA
The How to Make Money Trading Stock Show—Free Webinar every Friday at 11:00 a.m. PDT. This weekly live and recorded webinar helped traders find great stocks and ETF’s to trade with excellent timing and helped them stay out of the market during times of weakness.
How to Make Money Trading Stocks on Friday, March 10th
Register now for the next live webinar at the link below:
Register Here: https://attendee.gotowebinar.com/register/385843200414302723
Time 11:00 a.m. PDT
To get notifications of the newly recorded and posted How to Make Money Trading Stocks every week subscribe at the Market Tech Talk Channel: https://www.youtube.com/c/MarketTechTalk
Index Returns 2017 YTD
ATTS Returns for 2017 YTD Closed Trades
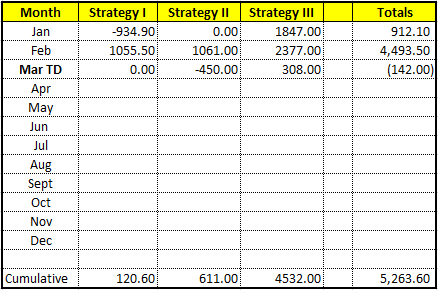
Percent invested initial $116.6K account: Strategies I & II invested at 23%; Strategy III invested at 26.6%.
Current Strategy Performance YTD (Closed Trades)
Strategy I: Up $120.60
Strategy II: Up $611.00
Strategy III: Up $4532.00
Cumulative YTD: 4.5%
Active Trend Trading’s Yearly Objectives:
– Yearly Return of 40%
– 60% Winning Trades
– Early Warning Alert Target Yearly Return = 15% or better
For a complete view of specific trades closed visit the website at: https://activetrendtrading.com/current-positions/
Updated first full week of each month. The next update after first week in March.
Outs & Ins: MDP is the only stock added to the IBD 50 mid-week. Meredith Corp finished out of the running for the best fundamental stocks after completing the sort on Fundamentals. In fact, only 2 stocks made it through the full sort. These are AMAT and ESNT. Dropping down one level below the top fundamental stocks brings NVDA, BEAT, NTES, CGNX, ANET and AEIS up for consideration.
About 70% of stocks move in synch with the Indexes. If the Indexes pullback and weaken then expect stocks on the IBD 50 to also pullback. This corresponds closely to historic seasonality where growth stocks move down during February or March and then start to rebound in April. This does not have to happen but does happen most years.

Share Your Success: Many of you have sent me notes regarding the success you are having with the Active Trend Trading System. Please send your stories to me at dww@activetrendtrading.com or leave a post on the website. Thanks.