Good Day Traders,
Overview & Highlights: Holding pattern waiting for the Fed. If the Fed follows the ECB lead we may see the rally strengthen after Wednesday.
Webinars: At Active Trend Trading we offer two webinars per week to provide training plus trade and market updates. See the schedule below for the next webinars.
How to Make Money Trading Stocks on Friday, March 18th
Register Here: https://attendee.gotowebinar.com/register/8615654741223664387
Next Training Webinar: March 16th
For Premium Members our Wednesday evening training is developing some fantastic traders!
Mid-Week Market Sanity Check Topic: Convergence of Clues
Managing Existing Trades: Only Strategy III trades open.
Strategy I Portfolio Building: No Open Trades.
Strategy II Income Generation: No Open Trades—if you trade options this is a good strategy to send up trial trades to see if the market’s direction may be changing. 1-5 contracts of one of the Index ETFs may provide less downside risk than long position in the underlying Index ETF. Trading options is not for everyone and I strongly encourage members to first become successful trading stocks and ETFs.
Strategy II stocks of interest for this week: AMZN, TSLA, AZO, NFLX & BIDU.
For members wanting to better understand this Strategy there is a very good training video at: https://activetrendtrading.com/basic-option-strategy/
Strategy III Wealth & Income Generation Trades: Two Foundational Positions are in place to sell weekly options against. The recalculated weekly revenue needed from these foundational positions was forward in an update report earning last week. My objective with this Strategy is to collect enough weekly premium during the life of the LEAPS Strangle on both SPY and TSLA to both pay for the capital invested and gain between 50% – 100%.
Tip for Experienced Option Traders: Occasionally after a weekly trade goes against me but the trend appears to be changing I will add one naked contract over and above my foundation position and close this out after it gains at least half of the premium I’ve collected. Doing naked options is not for everyone and I keep my risk small by only doing one contract above my covered limit. In other words if I can sell 4 contract covered by my long leaps I’ll sell one additional. This helps hedge the losses a bit but it this tactic is not without risk and must maintain a tighter stop than I would normally use with the regular position.
Note: We do our best to get both text alerts and email alerts out in a timely manner, occasionally there will be trades that are missed because of delay in the Text or Email alert applications. Additionally please double check with your broker to assure they allow spread trades like we do with Strategy III. Some do and some don’t.
Last Week’s Trades:
SPY: Profit +$469
TSLA: Loss -$25
Trade 1: Foundation Position is 4 contracts of SPY Jan17 205C and 4 contracts of SPY Jan17 200P Current Trade—Currently Up 0.01%
Opened 2 contracts SPY Mar 200 for a 2.46 Credit–$492 potential Profit
Opened 2 contracts SPY Mar 202.5C for a 1.25 Credit–$224 potential Profit
Trade 2: Long TSLA Jan17 250C & Long Jan17 220—Current Trade—Currently Up 39%
Sold 1 contract of TSLA Mar 207.5C at 5.40 worth $540 per contract
Several members have asked about this strategy and a more detailed explanation is available at: https://activetrendtrading.com/wealth-and-income-strategy/
I posted a video about how to choose the weekly options to short for this strategy. It can be viewed at: https://activetrendtrading.com/videos/
Additionally some of these trade may be selling weekly puts on up trending stocks. If you are interested in parallel trading this strategy register at this link: http://forms.aweber.com/form/99/1278533099.htm
Pre-Earnings Trade: Only a few more weeks left in the current earnings season. In an up trending market many stocks will provide upside trades with expected returns between 5% – 20%. Here are some potential stocks that may provide pre-earning moves: CALM, NKE & NOAH report over the next few weeks and may provide pre-earnings run. NOAH reports on 3/16 AMC. NKE and CALM may be the better candidates.
Potential Set Ups for this week: Expect most stocks to also be in a holding pattern waiting for the Fed. I will look for support and resistance bounces on the stocks below.
Upside: NKE & AVGO. NKE does have earnings on 3/22.
Downside: None
On the Radar: Stocks & ETFs that could go either way include: UPRO, SPXU, TQQQ, SQQQ, TNA, TZA, TSLA (214 resistance/140 support), NTES, SFM, NFLX, AMZN, OLED, PYPL, USCR, LGND, AHS & VEEV.
Stocks identified by ** are holding up well and may be upside movers if the market strengthens.
Early Warning Alerts for Leveraged Index ETFs: Waiting for Second Chance Entry trigger and Alert reset.
The Early Warning Alert Service hit all eight major market trading points in 2015. See this brief update video for more details: Early Warning Alerts Update Video or at https://youtu.be/GJwXCL4Sjl4
If simplifying your life by trading along with us using the index ETF is of interest you can get the full background video at: https://activetrendtrading.com/etf-early-warning-alerts-video/
General Market Observation: Last week each of the Tracking Indexes pushed higher with the current relief rally. The magnitude and staying power of this rally has many analyst scratching their heads and has led to a couple of fake out failures. Last week the catalyst that drove the market higher was the action of the ECB and comments by Mr. Draghi its president. This week the catalyst for market action will be the Fed which reports out on Wednesday March 16th. After Europe’s action last week will the Fed follow a “monkey see, monkey do” policy decision? We shall see Wednesday.
It’s always good to remember that regardless what our opinion may be, the Market doesn’t care! So while nothing has really changed since the big sell off at the beginning of the year the market has exceeded expectations since the bounce on February 11th. The markets will remaining in a holding pattern with an upward bias until after the Fed announcement. After the announcement Yellen holds a live press conference and these forays in front of the camera have tended to not foster a positive market reaction at least in the short term. Will the same be true this week?
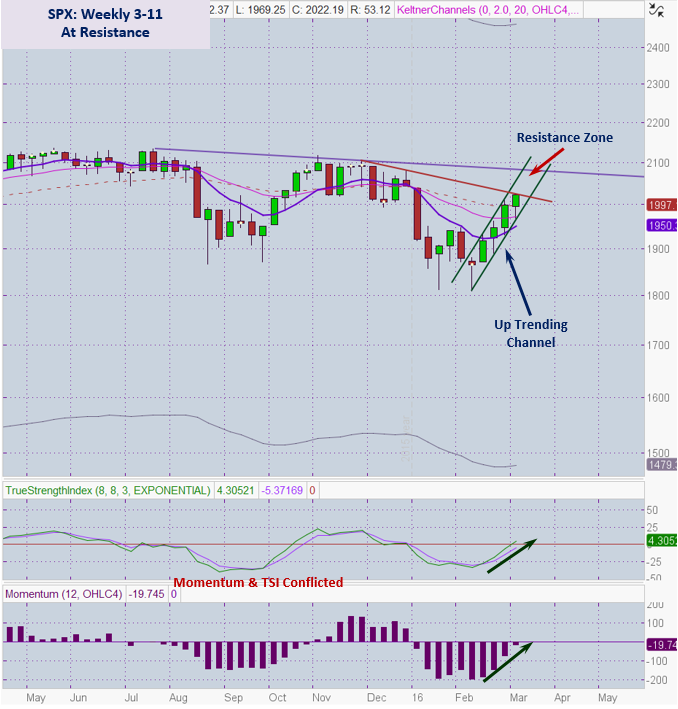
I’m including two SPX charts in this report to provide a deeper view of what the index is doing. On the weekly chart a steep trend channel can now be drawn covering the move since 2/11. Notice how the weekly prices have moved up in this channel with no violations. Price has now pushed up to the down trending resistance line connecting the highs from 12/2 and 12/29. Price action Friday stopped close to the high of the day but also right at this resistance. Above this level there is another down trend resistance line. If price drift up into the box formed by the short term uptrend channel and the two downward sloping trend lines then this may be a decision zone for pushing higher or reversing. If price are held in this zone prior to the Fed announcement a breakout move either way may lead to potential trades.
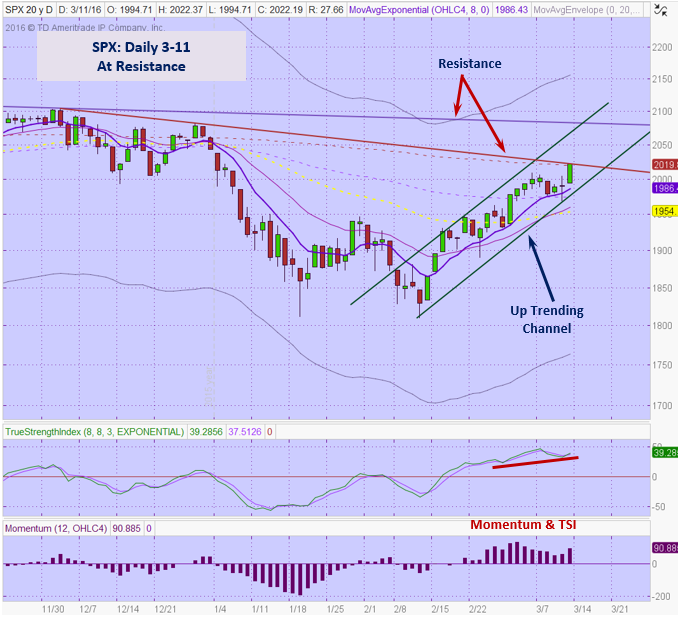
The upward sloping trend channel translates well to the daily chart. Note that all daily price action has been maintained within the channel. As long as this channel remains in effect the short term uptrend will continue. Unless price action gets to any of the extremes depicted by the various trend lines there is nothing actionable. If there is a breakout above the first downtrend line it may provide a limited long opportunity of about 2.8%. The SPX did close above the 200 day moving average so while it has not taken out the highs from last year some technicians may say that a new uptrend is in place. While this is happening some negative divergence is appearing on daily TSI. With this being the Fed week standing by is a prudent stance.
Both the NDX and RUT also made progress on Friday also. If the Fed stays an interest rate hike and send a message that there will be no hikes until June or later all indexes may react with a positive move. In other words it would be a positive reaction to bad economic news. Kind of what the market has been doing of late!
Remember that until the highs from last year are taken out current price action is considered a short term uptrend in the context of a longer term downtrend. Prices on the NDX and RUT are still below the 200 day moving average which also fits the definition of a longer term downtrend.
SPX: Downside Market Short the SPY, SPY Puts or SPXU.
Preferred Long ETF’s: SPY, UPRO and SPXL
NDX: Downside Market Short the QQQ, QQQ Puts or SQQQ.
Preferred Long ETF’s: QQQ and TQQQ
RUT: Downside Market Short the IWM, IWM Puts or TZA.
Preferred Long ETF’s: IWM and TNA
The How to Make Money Trading Stock Show—Free Webinar every Friday at 10 a.m. PDT. This weekly live and recorded webinar helped traders find great stocks and ETF’s to trade with excellent timing and helped them stay out of the market during times of weakness.
How to Make Money Trading Stocks on Friday, March 18th
Register Here: https://attendee.gotowebinar.com/register/8615654741223664387
To get notifications of the newly recorded and posted How to Make Money Trading Stocks every week subscribe at the Market Tech Talk Channel: https://www.youtube.com/channel/UCLK-GdCSCGTo5IN2hvuDP0w
- The Active Trend Trader Referral Affiliate Program is ready. For more information or to become an Affiliate please register here: https://activetrendtrading.com/affiliates-sign-up-and-login/
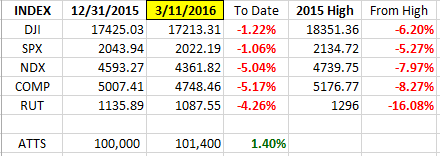
Index Returns YTD 2016
I’ve added a column to the Index YTD performance chart. The column on the far right shows the depth of the current correction with respect to the highs of the top from 2015.
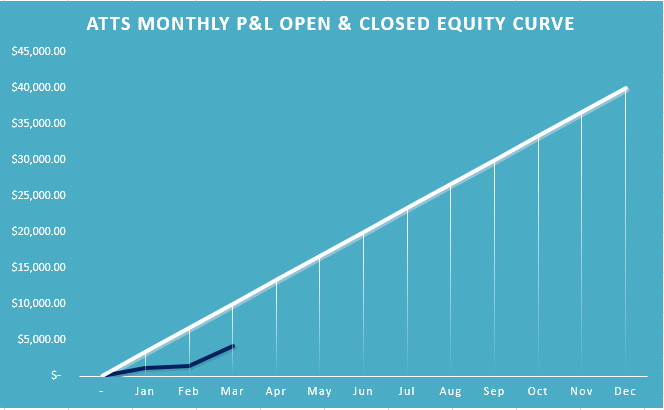
ATTS Returns for 2016 through March 11, 2016
Percent invested $100K account: Strategies I & II invested at 0%; Strategy III invested at 20%.
Current Strategy Performance YTD (Closed Trades)
Strategy I: Down -1054.75 or -1.5%
Strategy II: 1.65%
Strategy III: Up $5062 or +25.3%
Cumulative YTD: 4.1%
Active Trend Trading’s Yearly Objectives:
- Yearly Return of 40%
- 60% Winning Trades
- Early Warning Alert Target Yearly Return = 15% or better
For a complete view of specific trades closed visit the website at: https://activetrendtrading.com/current-positions/
Updated first full week of each month.
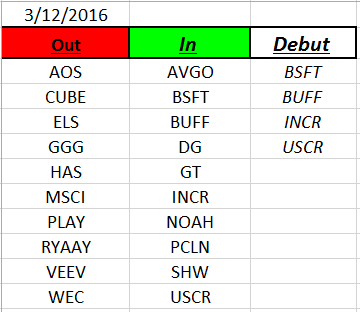
Outs & Ins: BSFT, BUFF, INCR and USCR make their debut to the IBD 50 this week. BSFT gapped higher on earnings two weeks ago and is holding onto the gains. On a longer term weekly chart there is not real trend only trading in a wide range between 20 and 40. BUFF, INCR and USCR all look interesting and may provide more immediate set ups. USCR is forming a cup with handle pattern and INCR is in the early stage of an uptrend. BUFF is a recent IPO and needs to do some backing and filling towards a breakout level at $20.
Both CALM and NOAH may complete pre-earnings run. I would favor CALM because there is over a week until earnings on 3/28 AMC. Watch AVGO for a breakout to the upside with an upside target of approximately 180 over a 4-5 week time period from breakout.
Share Your Success: Many of you have sent me notes regarding the success you are having with the Active Trend Trading System. Please send your stories to me at dww@activetrendtrading.com or leave a post on the website. Thanks.