Februrary 4, 2018
Good Day Traders,
The S&P has pulled back to about 3.9% within the past week. The other Tracking Indexes (NDX & RUT) also fell with the RUT dropping below the 50 day EMA to close the week. Remember that Topping is a process. If last week’s action, which was more violent to the downside, is the first indication of a more significant pullback or even correction at some point there will be a bounce and rally attempt to reach the past highs. If this move fails it will be a major clue regarding the trend and strength of move. From a trading perspective if the Indexes moved into horizontal range bound price action to work off excesses this would present a great trading opportunities the rest of the year. My question for the first full week of February is, will the Indexes bounce from current levels of drop further before an attempted bounce. We shall see!
Bounce Zones for Premium Members: If you are a premium member some very powerful conditional order setup information will soon be available to complement the Go-No Go Table each week. Chart showing zones where traders can expect prices to bounce due to supply and demand pressures. What does this mean for Premium members? Charts of our ETFs and Core Stocks with define Bounce Zones will empower you to place conditional orders around these areas for both entry and planned exits. This will be one more way Active Trend Trading will help Premium Traders with limit time for market analysis. Stay tuned for more on this beneficial feature!
Pre-Earning Runs for this week include TSLA & NVDA. Both face a strong head wind which will effect a pre-earnings run due to market weakness.
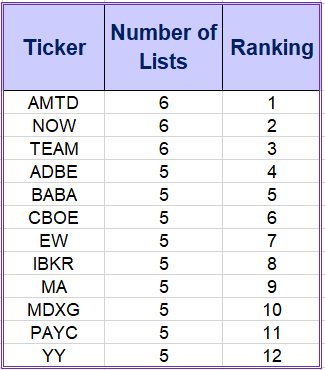
Remember to register for the After Market Monday and Making Money Trading Stocks and ETFs each week. In these webinars I will provide 10-12 stock set ups per year. All Levels of ATTS members will receive these trade email alerts. The NEW Composite Watch List provides a sort of all stocks that appeared on multiple Premium IBD Watch Lists this week. Often appearing on multiple list is a sign of strength and identifies a strong long term candidate. New Composite List Provided Below!
Register here to not miss the BONUS Trades or the ATTS Webinar Invitation list: https://forms.aweber.com/form/33/1084761733.htm
Running List, Strongest Fundamental stocks on the IBD 50 and the NEW Composite List of Stocks showing up on multiple IBD Watch List on Feb 3.
Running List: 70 stocks are on the 2018 Running list. Find the list here: Running 2-3
When the new IBD 50 list comes out twice per week I conduct a fundamental sort which results in the top fundamental IBD 50 stocks being identified. The top fundamental stocks for this week are: ANET, ALGN & HTHT. This sort is provided at: 2-3 Sorted
A new addition to the weekly watch lists for Active Trend Traders is a Composite List of IPOs and Growth Stocks appearing on multiple IBD watchlist each weekend. When a stock appears on multiple Premium Lists it can potentially be an indication of excellent strength. The stocks on the weekly Composite List may not be at a sound trigger point but may be worth watching for future entries. I will do an analysis of the list looking for price near potential triggers. Stocks near potential triggers will be highlighted. The top stocks appearing on more than one IBD watch list last week are shown in the table below. The Composite List for this week: Composite 2-3