Good Day Traders,
Overview & Highlights: Mike’s Macro Market Musing provide some excellent insight into what may lie ahead if the markets are in fact getting overheated with the Trump Rally. With only 8 more trading day remaining in 2016 it appears that the market is not going correct due to the interest rate hike from last week’s Fed meeting. We have a great stable of stocks and ETFs that will continue to simplify selection going forward. The one ingredient we currently need is a proper entry point on some of these.
Upcoming Webinars: At Active Trend Trading we offer two webinars per week to provide training plus trade and market updates. See the schedule below for the next webinars.
The How to Make Money Trading Stock Show—Free Webinar every Friday at 11:00 a.m. PDT. This weekly live and recorded webinar helped traders find great stocks and ETF’s to trade with excellent timing and helped them stay out of the market during times of weakness.
How to Make Money Trading Stocks on Friday, Dec 23rd
Register now for the next live webinar at the link below:
Register Here: https://attendee.gotowebinar.com/register/7655850365625221889
Time 11:00 a.m. PDT
Next Training Webinar: Dec 21st
For Premium Members, our Wednesday evening training is developing some fantastic traders
Topic: How to set up the Foundation Position for Strategy III
Mike’s Macro Market Musings: U2, U3, and Passive Investing
For purposes of the following discussion, let’s first define a few terms. U3 is the commonly referred to headline unemployment rate regularly reported by the mainstream and financial media. “Passive investing” refers to long term passive buy and hold investing of popular U.S. equity indexes. And U2 is one of my all-time favorite rock bands. One might reasonably wonder, where in the world is this guy going with this? How are those things related? Glad you asked. Allow me to explain.
Since the lows of March, 2009, the S&P 500 (SPX) has more than tripled, advancing some 226%. The Russell 2000 (RUT) and Nasdaq (COMP) have advanced north of 300% off those lows, more than quadrupling. Given the magnitude of those returns in a time span of slightly less than 8 years, retail investors are understandably now singing the praises of passive long term buy and hold index investing, and putting their money where their mouths are. While it is certainly true that passive index investing can be an excellent strategy for most of the retail investing public, it all comes down to timing, as is true in many aspects of our lives, and the length of the “hold” period in the buy and hold dynamic. Passive investing works best when implemented near the bottom of an economic cycle at periods of extreme pessimism and tends to not work out great when implemented at periods of extreme optimism near the tops of economic cycles, especially if the “hold” period only spans from a cycle top to the subsequent cycle bottom.
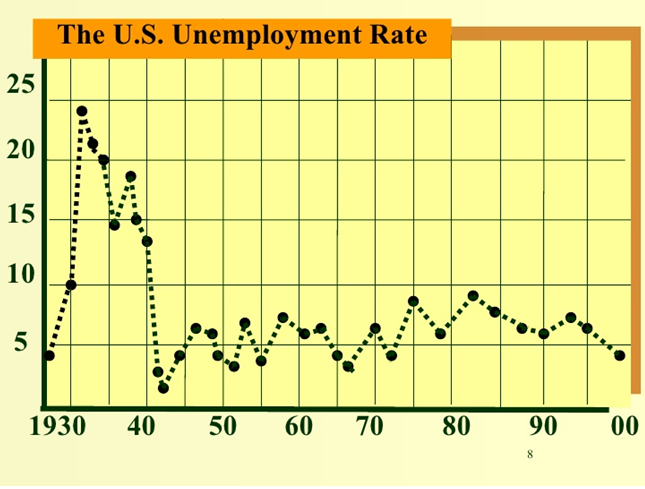
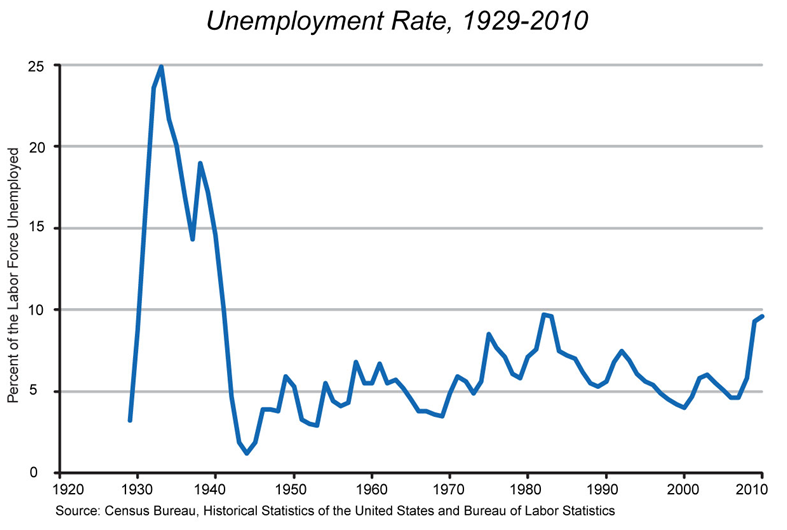
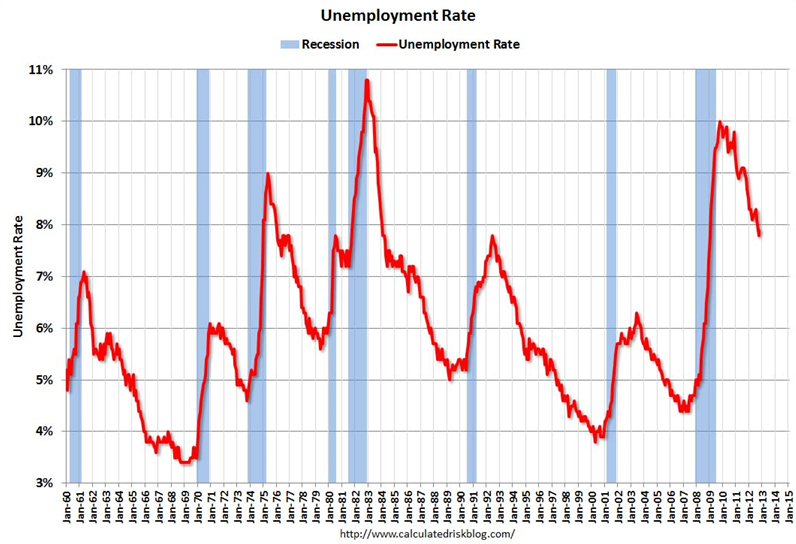
OK, so how might we know in real time that we’re at or near an economic cycle top or trough? The current unemployment rate as measured by U3 (let’s disregard for this discussion the inherent flaws in this popularly referred to measure of unemployment) can provide a clue, as indicated in the following charts:
What is the take away from the above graphic illustrations? While not a perfect timing indicator, nor is it meant to be, current unemployment rates can provide valuable information related to the prospects for long term buy and hold passive investing. When unemployment rates are at peaks during times of recessions, history shows that implementing longer term passive positions is an excellent strategy. For example, in the charts above, look at unemployment peaks around 1932, 1938, 1982, 1992, and 2009 – these proved to be the start of very large and important cyclical or secular bull markets in U.S. equities. Precise timing of buy and hold passive positions was not necessary, excellent returns during the following years were “baked into the cake” around these times. The flip side of this particular coin, so to speak, is to consider what happens going forward from times when unemployment rates have bottomed and coincided with economic cycle tops. Unemployment rates between 4 – 5% have historically proven to be associated with economic cycle tops and intermediate to long term stock market highs – in the charts above, good examples of this are seen around 1929, 1966-1969, 1973, 2000, and 2006 – 2007. These are all periods almost immediately preceding significant, even historical, stock market declines. Consider that Warren Buffett closed his famous original investment partnership, an early version of a hedge fund, in or around 1966 when unemployment rates were beginning to dip below 4% – do you think he knew something then that most people did not know at that time? Also, consider that in the history of the United States the unemployment rate has seldom gone below 4%, when it does it doesn’t stay there long (a factoid I learned in a class in college that I somehow remember and that has held up for over 40 years now).
OK, wise guy, so what does unemployment look like currently? U3 is at 4.6% just in the past week, down from the 10% reading of 2009. Along with a CAPE approaching 28 (see my most recent article on market on CAPE and market valuations), it is highly likely that equity index returns for the next several years will be poor, regardless of the current euphoria resulting from the historic rally of the most recent several weeks. It would be a good idea to not get caught up in that euphoria when considering committing new money to a long term buy and hold passive investment position at this point in time.
Will the market crash any time soon? Unlikely, although anything is possible. Just don’t expect the next 8 years to offer the same returns as the past 8 years, a period of time immediately preceded by a U3 of 10%. To paraphrase a well-known U2 song lyric (I know, you were wondering when I was going to get around to that), you might want to be able to say “I’m ready for what’s next, I’m ready for the crush”. Or, perhaps, “I told you so”.
General Market Observation: While the Trump Rally has slowed, price action remains positive going into the next to the last week of 2016. The Indexes are handling last week’s interest rate hike totally different than December of 2015. So, what’s holding this market up? It appears it’s the positive expectation for 2017 and the speculation for an improved business friendly administration. Each of the three Tracking Indexes are showing no signs of dropping, but the upward surge has slowed. While I do not track the DOW, it must be noted that this Index is just a breath away from 20000. When this objective is achieved will the Indexes then go into pullback mode? We shall see. Of course, the Indexes may push even higher if the euphoria gets over blown with positive expectations going into 2017.
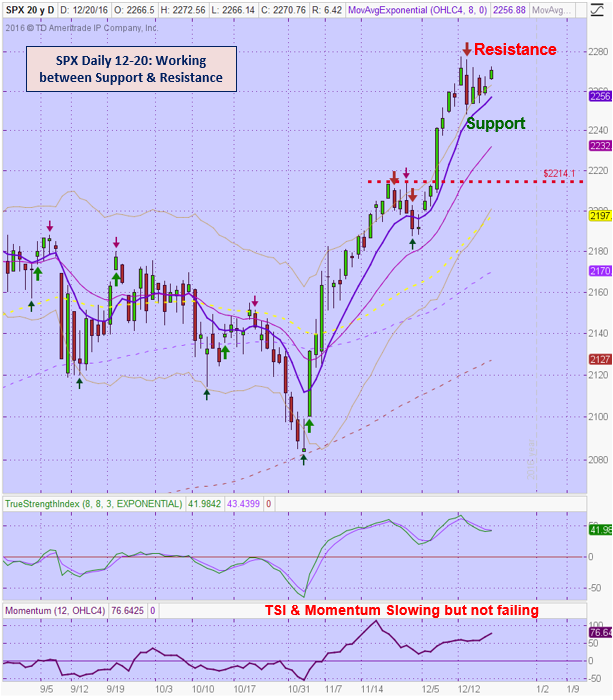
The SPX is working within support and resistance between the 2248 and 2277 levels respectively. There is a slight negative divergence on both the daily and weekly charts. This doesn’t mean the Index is ready to drop but it is a clue that upward momentum is waning. Given that the internals of all the Indexes has not really changed since the election, when price action breaks to the downside it may be violent. For now, we must recognize that the SPX is in an uptrend that is still in place regardless of how steep the move has been.
The NDX has not participated in the recent rally to the extent that the other members of the Tracking Indexes. Over the past 5 days there have been two strong bearish price moves and three positive days. Resistance at the 4691 level is well defined at the top of the Keltner Channel. TSI and Momentum on the weekly chart shows negative divergence. If sellers are overcome at resistance price action may push up to 5000 to finish the year.
The Russell (RUT) has provided two orderly pullbacks since November 2nd. It too has well defined support and resistance between the 1353 and 1393 levels. There is negative divergence present on both the daily and weekly charts. At this point there now other clues of weakness are visible. It is a bit surprising that there has not been a more negative reaction to higher interest rates in this small cap Index. Like the SPX, the RUT is in an uptrend that seems to have slowed but not stopped.
SPX: Downside Market Short the SPY, SPY Puts or SPXU.
Preferred Long ETF’s: SPY, UPRO and SPXL
NDX: Downside Market Short the QQQ, QQQ Puts or SQQQ.
Preferred Long ETF’s: QQQ and TQQQ
RUT: Downside Market Short the IWM, IWM Puts or TZA.
Preferred Long ETF’s: IWM and TNA
The How to Make Money Trading Stock Show—Free Webinar every Friday at 11:00 a.m. PDT. This weekly live and recorded webinar helped traders find great stocks and ETF’s to trade with excellent timing and helped them stay out of the market during times of weakness.
How to Make Money Trading Stocks on Friday, Dec 23rd
Register now for the next live webinar at the link below:
Register Here: https://attendee.gotowebinar.com/register/7655850365625221889
Time 11:00 a.m. PDT
To get notifications of the newly recorded and posted How to Make Money Trading Stocks every week subscribe at the Market Tech Talk Channel: https://www.youtube.com/c/MarketTechTalk
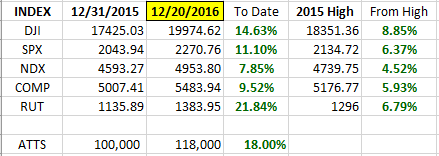
Index Returns YTD 2016
ATTS Returns for 2016 through Dec 20, 2016
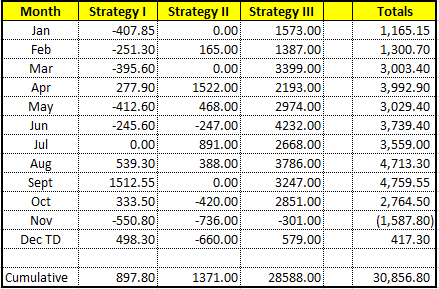
Percent invested initial $100K account: Strategies I & II invested at 20.00%; Strategy III invested at 15%.
Current Strategy Performance YTD (Closed Trades)
Strategy I: Up $896.15 or +1.28%
Strategy II: Up $1,371.00 or +13.7%
Strategy III: Up $28,588.00
Cumulative YTD: 30.8%
Active Trend Trading’s Yearly Objectives:
– Yearly Return of 40%
– 60% Winning Trades
– Early Warning Alert Target Yearly Return = 15% or better
For a complete view of specific trades closed visit the website at: https://activetrendtrading.com/current-positions/
Updated first full week of each month. The next update after first week in January
Outs & Ins: No new stocks were added to the IBD 50 list this in today’s update. The stocks with the strongest fundamentals are THO, CPE, NVDA, AMAT, UBNT and WAL. CPE is closest to a pullback entry opportunity off the 50 day Moving Average.
Share Your Success: Many of you have sent me notes regarding the success you are having with the Active Trend Trading System. Please send your stories to me at dww@activetrendtrading.com or leave a post on the website. Thanks.

