January 7, 2018
Good Day Traders,
The first trading week of 2018 ended with a couple of setups to acted on at the beginning of the second week! I will send out a Order Alert this weekend for the first ATTS BONUS Trade of 2018. I remind everyone, my objective is to provide 10-12 trade setups for all Active Trend Trader during the year. These trades will be based on ATTS 4 Entry Rules and 6 Exit Rules. It’s my way of saying “thank you” to all Active Trend Traders including the Free Newsletter members and Premium Members.
Today’s edition includes Mike’s Macro Market Musings. His first topic of the year is: Records Are Records For A Reason
In 2018, I will provide a Study in Compounding. That sound really boring so I’ve renamed the study, How to Buy a New Lexus for $5,000. A brief video on how to do this posted in the Tech Tips on my YouTube Channel. I’ll report how I’m doing each week in this challenge of trading TSLA Strategy 2 Options starting with $5,000 in capital. Each week I’ll make a trade that trades my base capital plus earned capital. This week I’m starting with $5,560.
Mike’s Macro Market Musings: Records are Records for a Reason
2017 is done now. Over. Kaput. One for the record books, at least as far as the equity markets are concerned. It is usually prudent at the end of the year to review the past year as part of preparation for the new year. So let’s take a look back at the equity markets and their performance in 2017 and see what lessons, if any, might have been taught that we may want to heed.
2017 was a record year for the U.S. and global equity markets in many ways. “Record”, as in all time, never seen before in history, records. A perfect year. Is the market environment we have witnessed and are currently witnessing the new normal? My answer – not likely, but anything is possible. Actually, that isn’t quite true – I am short (or, at least, not very tall) and have never been able to dunk a basketball; me dunking a basketball is a good example of something that is not possible. But I digress. While the following list is not an exhaustive all inclusive one, I believe it will certainly illustrate the point of how remarkable and unprecedented 2017 was for the equity markets.
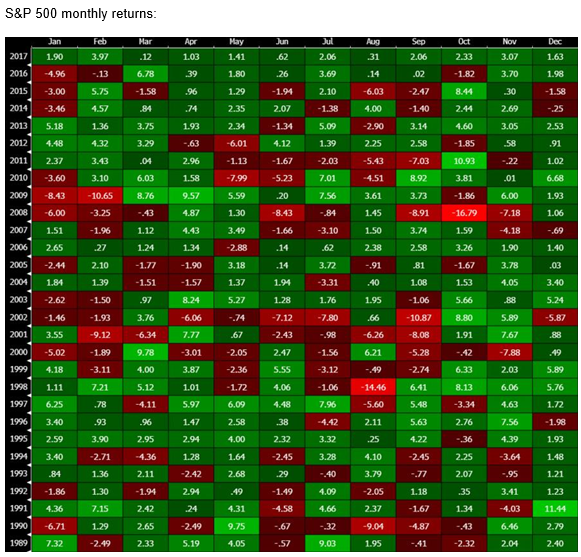
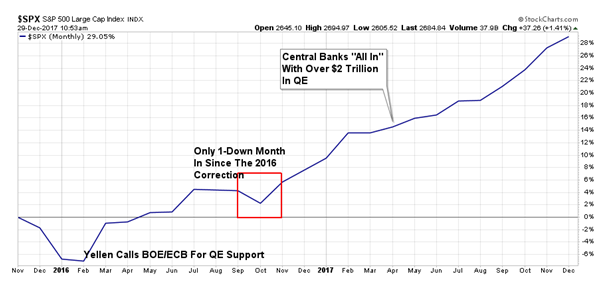
1) Neither the U.S. or global equity markets had a single down month. Not one. Every month closed higher than the previous month. This has never happened before. Never. In fact, global equity markets have risen for 13 consecutive months and the S&P 500 has done so for 14 consecutive months. As a side note, the S&P has been up for 21 of the past 22 months. Think about that – only one down month in nearly 2 years!
 S&P 500 monthly returns:
 2) But not only was the upside incredible, there was no downside!! Based on cumulative losses, stocks endured less adversity in 2017 than any other year on record, going back more than 100 years.
Specifically, consider the amount of losses incurred during every down day in the market. Using the Dow Jones Industrial Average (DJIA), as it has a longer history than the S&P 500. And based on these calculations, the stock market enjoyed less adversity in 2017 than any other year in history going back over 100 years ( daily DJIA data depicted in the chart below begins in 1915).
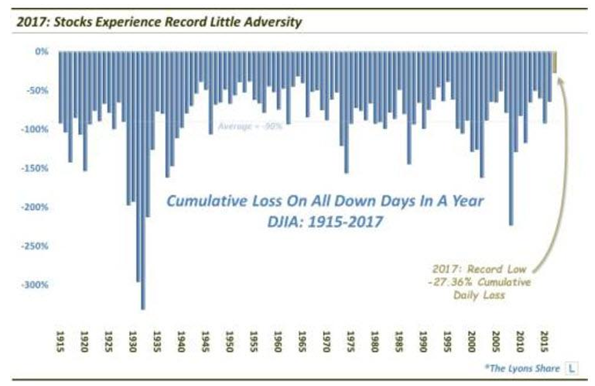 As of December 27, 2017, the DJIA had lost a cumulative -27.36% on all of its down days throughout 2017. That shattered the prior record of -31.45% set in 1965 which, by the way, is the only other year that saw less than -38% in total losses. So, other than 1965, 2017 experienced nearly 30% less adversity than any other year on record. To add further context to this extraordinary performance, the average cumulative loss on down days during a year in the DJIA is 90%. That comes out to an average cumulative monthly loss of 7.5% — versus 2017’s average monthly loss of a mere -2.28%.
3) 2017 was a record low year for average volatility as measured by VIX
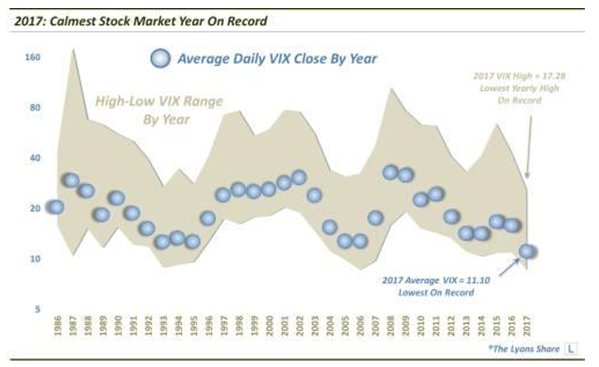 Furthermore, as the chart states, the maximum level reached by the VIX in 2017 was 17.28. That is the lowest maximum level attained in any year since inception — and 60% lower than the “average yearly max”. Obviously 2017 was an extraordinary year in its lack of stock volatility. Since its inception in 1986, the average annual reading for VIX has been right around 20, yet in 2017 the highest reading for the year was approximately 15% below the long term average
Note: for those of you who subscribe to our EWA service and who may be lamenting the lack of signals and opportunities this past year (there was only one good bona fide alert this past year, which worked out very well), this explains it. It was a year without precedent in many ways. Dennis and I certainly cannot be held to blame.
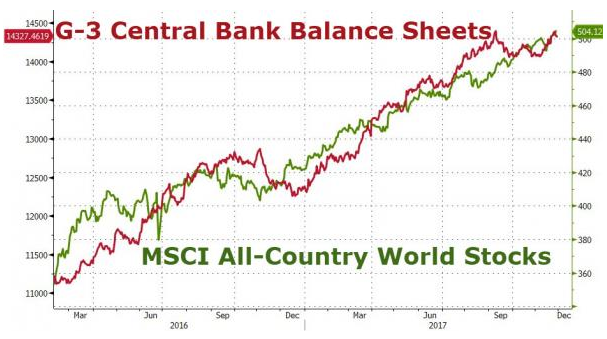
4) Global central banks are, or have been, printing more money than they ever have. More. Than. Ever. In fact, in 2017 global central banks (think the ECB, BOJ, BOE, Swiss National Bank, for example) printed in the ball park of $2 trillion USD, more so than even at the height of the so called financial crisis in 2008 -2009 when global financial institutions that were in trouble were being bailed out on a seemingly daily basis. This is neither the time or place to debate why the central banks are still doing this at a time when there is no economic or financial emergency apparent – let’s just say I am certainly not the only one to consider their actions irresponsible, to put it politely.
And make no mistake – nearly all of that newly printed money is being pushed into the financial markets and a good portion of it has, and will, find its way into the U.S. markets. Note the correlation in the following chart between the incessant rise in global central bank balance sheets and the persistent increases in levels of global equity markets:
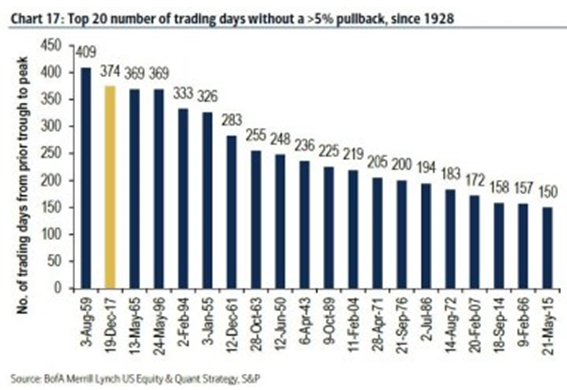
 5) The market has now gone an almost record number of trading days without so much as a 5% correction. 375 trading days and counting. Approximately 1 1/2 years. While not quite an all time record for number of trading days without a 5% correction, it’s getting pretty close to being one.
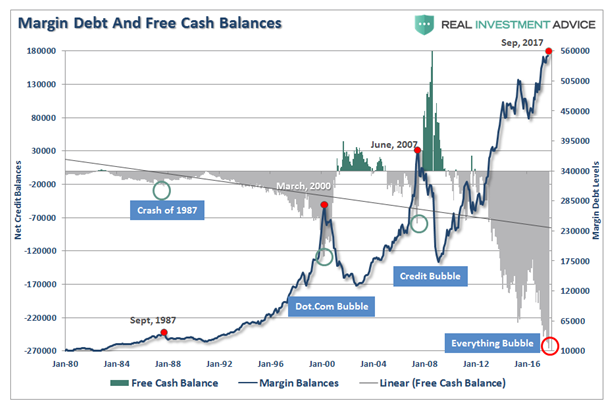
 6) Margin debt is now at levels never seen before. Nearly double what it was at the peak of the dot com bubble.
 I could go on, but hopefully you get the point by now. Records are records for a reason. They represent extremes in sentiment and psychology that significantly deviate from established and historical norms whether to the upside or downside, a consequence of a “herd” mentality that can prevail for far longer than one might rationally expect. Such extremes have happened before and will no doubt happen again – that is, unless the fundamental characteristics of human nature change. Said extremes (again, either to the upside or downside) also have always historically been proven to be temporary or transitory, artificially produced, and self-correcting. I have no doubt that, ultimately, it will not be different this time. For those of you who have become actively involved with investing and trading in just the past 2 – 3 years, it would be natural to assume that the market environment as delineated above is normal – after all, that is what your experience has been so far. Believe me, there is nothing normal about any of the circumstances itemized above.
Records are records for a reason. With that in mind, best wishes for a happy and prosperous 2018! Stick to your rules, respect your stop losses, appreciate and enjoy your journey.
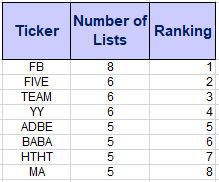
Remember to register for the After Market Monday and Making Money Trading Stocks and ETFs each week. In these webinars I will provide 10-12 stock set ups per year. All Levels of ATTS members will receive these trade email alerts. The NEW Composite Watch List provides a sort of all stocks that appeared on multiple Premium IBD Watch Lists this week. Often appearing on multiple list is a sign of strength and identifies a strong long term candidate. New Composite List Provided Below!
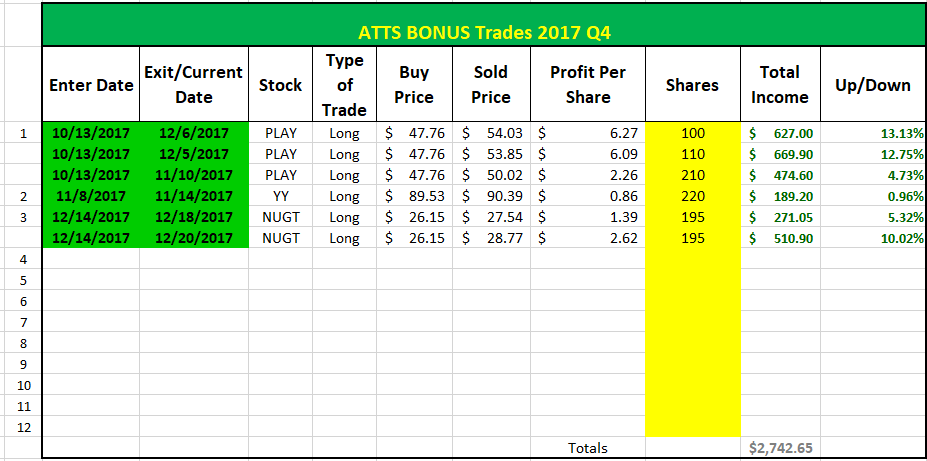
Here’s a list of the BONUS Trades since October:
 Register here to not miss the BONUS Trades or the ATTS Webinar Invitation list: https://forms.aweber.com/form/33/1084761733.htm
Running List, Strongest Fundamental stocks on the IBD 50 and the NEW Composite List of Stocks showing up on multiple IBD Watch List on Jan 5.
Running List: 54 stocks are on the 2018 Running list. Find the list here: Running 1-5
When the new IBD 50 list comes out twice per week I conduct a fundamental sort which results in the top fundamental IBD 50 stocks being identified. The top fundamental stocks for this week are: OLED, ANET, ALGN, HTHT & FIVE. This sort is provided at: IBD 50 1-05-18 Sorted
A new addition to the weekly watch lists for Active Trend Traders is a Composite List of IPOs and Growth Stocks appearing on multiple IBD watchlist each weekend. When a stock appears on multiple Premium Lists it can potentially be an indication of excellent strength. The stocks on the weekly Composite List may not be at a sound trigger point but may be worth watching for future entries. I will do an analysis of the list looking for price near potential triggers. Stocks near potential triggers will be highlighted. The top stocks appearing on more than one IBD watch list last week are shown in the table below. The Composite List for this week: Composite 1-5-18