September 17, 2017
Good Day Traders,
Fed reports out on Wednesday. Will the outcome influence a pullback in the Indexes as a stab at September weakness? We shall see. I’ll be patient as the Fed’s decision plays out. Excellent article from Mike today with an update of the Long Term Trend Following Strategy! While there is a lot of interest in keeping the Indexes up, eventually gravity and inertia will take over. When? We shall see!
Mike’s Macro Market Musings: A Stock Market With Bad Breadth and An Updated Back Test On A Long Term Trend Following Strategy
It feels to me that we have been discussing almost ad nauseum nearly forever the undue influence of a relative handful of big cap stocks, most notably the FANG stocks (as they’re referred to), on the equity market indexes we most commonly monitor such as the Dow, the Nasdaq, and the S&P 500. Remember, the Dow is a price weighted index and the Nasdaq and the S&P are market cap weighted. Quite literally, just six stocks or so have accounted for a significant portion of recent gains in these indexes.
But don’t just take my word for it. The following chart will graphically illustrate this dynamic. It depicts the price action of SPXEW vs. the S&P (SPX) itself. SPXEW is an equal weighted S&P 500 index in which each component stock has an equal weighting no matter what its market cap may be. The chart also contains a correlation indicator depicting the correlation between the two indexes with a look back period of 200 trading days.

So, what exactly are we looking at here? Glad you asked. Here are the things that stand out to me:
1) While SPX has been steadily rising without much in the way of pullbacks for nearly all of the past 12 months, SPXEW has been in an undeniable downtrend (lower highs, lower lows) during that same time period
2) SPXEW has put in a potentially significant long term double top which hasn’t yet quite been confirmed
3) The correlation between the two indexes is obviously now negative as shown by the correlation indicator and is, in fact, more negative than it has been for over 10 years – a significant divergence
4) Periods of negative correlation often, if not always, seem to be followed by some sort of a correction in SPX
This dynamic is telling us that the relatively smaller stocks in the S&P 500 are not participating in the recent market rally to anywhere near the same extent as are the larger stocks. So, why does this matter? Historically, narrow breadth in the markets associated with rallies that are overly dependent on just a handful of stocks ultimately result in failure of those rallies and significant corrections in the popular indexes at some point in time, the only current unknowns being the timing, duration, and ultimate magnitude of such.
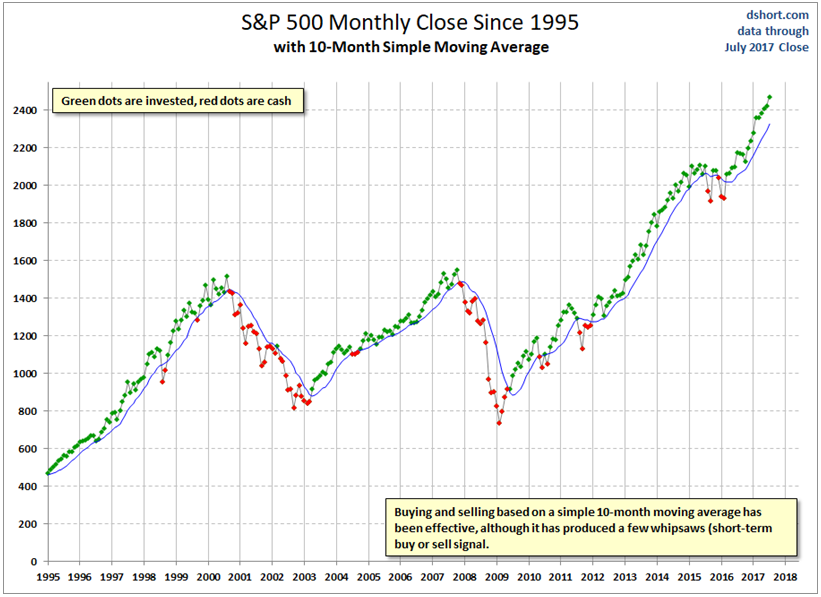
Now, another topic for discussion. In these columns I have recently touted the apparent effectiveness of a very simple long term trend following strategy that can easily be utilized for longer term investment accounts, especially those that offer few choices in terms of both investment vehicles and allowable trading frequency. The following chart, which has been shown before (for those of you who may have missed it), visually depicts this strategy going back to 1995. The strategy consists of nothing more than going long the overall market when the S&P 500 closes above its 10 month simple moving average (SMA) and staying long until the price of SPX closes below the 10 month sma, at which point the position is sold and the proceeds kept in cash. Following the chart are some statistics showing the results of this strategy for the time period 1995 – 2017; again, this has been shown before but I am posting it again for those who may have missed it the first time:
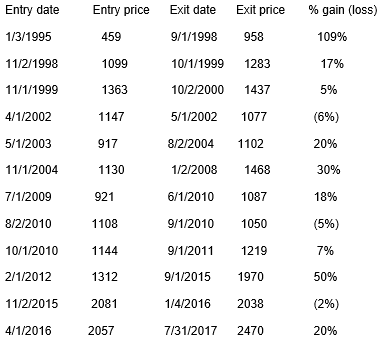 12 trades over a 22 year period with a 75% win rate with an average hold time for the trades of nearly 18 months. Average gain for winning trades = 30.7%, average loss for losing trades = 4.3%
I have been so personally intrigued by the potential success and application of this strategy that I decided to go ahead and back test it over a significantly longer time period to see how the potential results might hold up since the above results are from a very small sample size of only 12 trades. In fact, I went back to 1950 so that the following results would incorporate 67 years of price data. Here are my results for that back test:
Total number of trades = 46; 31 winners, 15 losers; win rate of 67%
Avg. gain = 20.8%; Avg. loss = 4.1%
Profit factor (expectancy) = 10.33 (i.e. system produces $10.33 in gains for every $1.00 lost)
Keep in mind that the above statistics are for the non-leveraged SPX index itself. Use of leveraged etf’s will magnify these results both to the upside and downside. Leveraged etf’s were not available for most of the back test period. For some perspective, any trading methodology that provides an expectancy or profit factor greater than 2 is usually considered by the trading and investing community to be worthy of consideration. An expectancy in the neighborhood of 10 is truly off the charts, so to speak. I invite you to further explore this methodology for yourself and consider utilizing it going forward for your longer term investment accounts if you’re satisfied by your investigation of its potential long term effectiveness
Running List & Strongest Fundamental stocks on the IBD 50 for September 17th
Fed Week! Waiting until Wednesday afternoon before making any big trades.
Running List: 180 growth stocks have appeared on the IBD 50 in 2017. No stocks were added to the IBD 50 today. Here is the total Running List, download the full list here: Running List 9-17
Additionally, when the new IBD 50 list comes out twice per week I conduct a fundamental sort which results in the top fundamental IBD 50 stocks being identified. The top fundamental stocks for this week are: COHR, BABA, ANET, YY. This sort is provided at: IBD 50 9-15 Sorted
Lastly, to sign up Free Webinars for this week at the GO HERE links below!
After Market Monday Webinar Sept 18th: GO HERE
Making Money Trading Stocks & ETFs Webinar: GO HERE
HOME