Good Day Traders,
Can we all say summer doldrums? This is a time to modify your stance for the next 3 months late summer into early fall. The positive thing that unlike the leaves that will be falling off the trees in a few more weeks, the stocks that are starting to fall from the skies right now might actually find the ground and then bounce in last September or early October. But this year could be different, we will see.
We can also look at the summer doldrums as trading’s off season. In sports, off seasons are used to work on one’s game and techniques. If trading were a sport, this is a great time to refine system execution, practice trade simulations, actually read the Trade Journal, enjoy the rest of the summer and the start of college football season!
David Grandey & I are taking the rest of the summer off from doing the live “Market Stock Talk Show” every Friday—because it’s August and not typically the strongest time to trading during the year. We will still do a recorded show and post it to YouTube. To get notification of the newly recorded and posted Market Stock Talk during the month of August just subscribe at the Market Tech Talk Channel: https://www.youtube.com/channel/UCLK-GdCSCGTo5IN2hvuDP0w
Additionally, please give David & me some “Thumbs Up” Likes and leave comments on the Market Tech Talk YouTube Channel we would really appreciate the gesture. If you share the site it would be even better! Thanks ahead of time.
General Market Observation: The market continues with a rating of Uptrend under Pressure with distributions days starting to grow again. This has been the status of the market for several weeks with price on the Indexes not gained much traction either up or down. I’m using my review time this weekend to study the monthly charts on the indexes since July just ended. Do these charts reveal anything to be concern about? We must remember to keep everything in the context that each moment in the market is unique, but there is a tendency for price patterns to repeat.
The question I’m asking this weekend is, “does it appear that the Indexes have moved into a topping process that could be more substantial than the short and shallow corrections experienced over the past couple of years?” July’s price action on the S&P, Nasdaq and Russell showed weakness, but the overall uptrend remained intact. Will the weakness lead to a full blown correction or just another short and shallow move to a significant level of support? We may find out this week!
On the daily charts all three Indexes closed below the 50 day SMA with negative 8 day/20day moving averages crosses now in place. Plus some previous daily Swing Lows have been breached to the downside. These are some of the first clues that must be in place for more significant move to the downside.
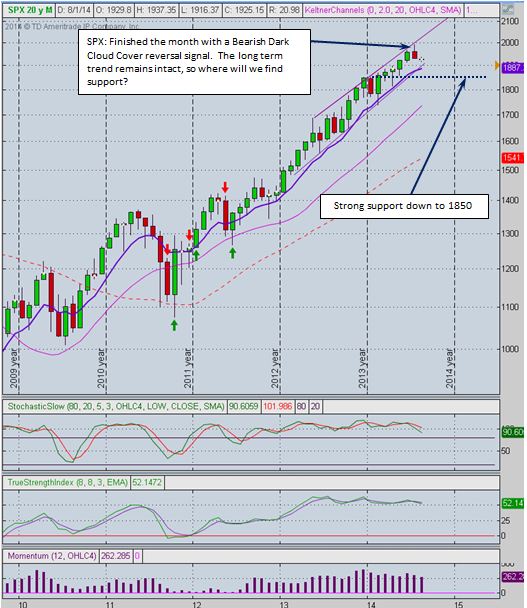
SPX: For the year the S&P is up 4.15% but lost about 3% of its yearly gain since the end of June. On a monthly chart last month’s price action resulted in a Bearish Dark Cloud Cover which is a candlestick reversal pattern. After a year like the S&P had in 2013 it is not a surprise for the following year to be less powerful. The real test of the S&P will take place between 1870 & 1900 which represents a strong support zone. The current uptrend has been in effect since the 20% correction back in 2011, so is a significant correction due time wise? Yes—we just don’t know when. So we continue to look for the patterns and the clues.
 Click to Enlarge
Nasdaq: Up over 4% for the year but has also given back about 3% of the yearly gain achieved through June. In other words the Index was up over 7% at the end of June! The long term uptrend started 2011 is still in effect. For the past month the Nasdaq has moved sideways and finished last week with a Bearish Engulfing pattern and price action that actually pierced support at 4352 and also closed below the breakout level of 4371.
RUT: The Russell continues to be the weakest of the three Indexes I follow as it completed the month with a full blown Bearish Engulfing pattern on a monthly chart but continues to live with in a lateral range and is now approaching the lower level of this range—again! The 20 day SMA crossed below the 50 day SMA and the slope on both the 100 and 200 day SMA’s is rolling over. The Russell on a daily chart has now put in lower highs and lower lows, so I’ll be looking for bearish trades in TNA, unless there is a very convincing bounce at a strong, strong support area.
Support zone at 1080 – 1100 and a break of these levels could lead us down to 1050 or lower.
 Click to Enlarge
Summary of Closed Trades:
Profit/Loss from Trades Closed in July as of July 31th
Income Generating Trades Closed = + $ 807.00
Capital Growth Trades Closed = + $ 456.00
Total Profit/Loss Month to Date = + $ 1263.00
Total Booked Profits since June 1 when the timing service began: $8.2K
Margin Account Up 21.4% YTD
IRA Account Up 34.5% YTD
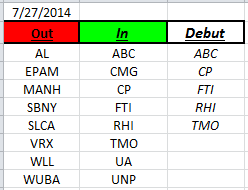
Outs & Ins: CDW & VNTV make their debuts on the IBD 50 this weekend. While CDW is pulling back nicely to the 50 day SMA, it is not a barn burner in it percent gains! If it does bounce here and move back to previous highs it is only a trip of about 5%. While it appears that this is a slow mover, it is up over 30% for the year and it has been a steady climb.
Over 30% of the IBD 50 will report earnings over the next couple of weeks so we could see a lot of movement both on and off the list. The Running List has grown to 167 stocks and many of these stocks are also reporting earnings during this period. Some of the big names reporting this week include JAZZ, YY, FANG, and ACTS.
 Click to Enlarge
Comments and opinions written below this line of text may be provocative and only obliquely related to trading. Some may find these “Off the Wall” comments challenging to their outlook on life. I will not post any comments made on subject matter below this line, so if you disagree blast away.
OFF THE WALL

Off the Wall: My wife is a remarkable lady! Every day she does meditation and quiet time to gain patience, wisdom and strength so she can face another day together with me. Not that I’m challenging to live with or anything. This week she came to me and said listen to this and began to read.
“Hope and courage go hand in hand. When you are waiting, waiting, waiting for long overdue answers to prayers, dreams and desires; it takes courage to continue hoping in something bigger than you. The world, the fear, the flesh and those little devils tell you it’s easier to just give up and give in to the dull disappointment. In a sense this is true. To keep hoping and praying with positive expectation requires a lot of effort and perseverance; giving up is momentarily easier. However, a resigned, I-give-up attitude is always hurtful in the long run. Often, this leads to cynicism—and eventually to despair. So it’s worth the effort to keep you hopefulness alive!”
She went on to tell me that the French word “courage” comes from the word “heart”. We need the strength to live courageously—facing adversity or danger with confidence and determination. Because where there is courage, fear flees.
All I could say after she shared this was WOW! I know many traders who are living in the dull disappointment with their trading. Not pleased with results or consistency often demanding perfection when perfection is not possible. The slip into the despair of giving up when what is needed is not just wishing things would change but truly putting action to their hope by learning how to change them with courage. The journey takes time, but it is worth it!
Share Your Success: Many of you have sent me notes regarding the success you are having with the Active Trend Trading System. Please send your stories to me at dww@activetrendtrading.com or leave a post on the website. Thanks!