Good Day Traders,
The grandson hasn’t arrived yet so we remain in wait mode-anytime now! The first article for Forbes online will be out towards the end of the week. I’m looking forward to a great May! Some of the minor refinements we’ve made over the first part of 2015 will start to be more and more apparent going forward as we are currently seeing in the YY position. Standby for some fun!
Performance of trades through the end of April will be posted to the website this weekend and ready Monday May 4th.
Thanks for all the great comments about the ATTS service and the “How to Make Money Trading Stocks” webinar that blast out every Friday at 10 a.m. Pacific. You can either join live or catch the replay on YouTube.
Here’s the link for next Friday’s Show: https://attendee.gotowebinar.com/register/4375346360294807297
The Mid-Week Market Sanity Check this Wednesday evening.
Our Topic: ATTS Rules with the Hull Moving Average
It is a privilege to have Mike Trager talk about the current Chinese Stock Market bubble. Mike provides is a very welcome addition and always brings thought provoking and timely topics to the forefront.
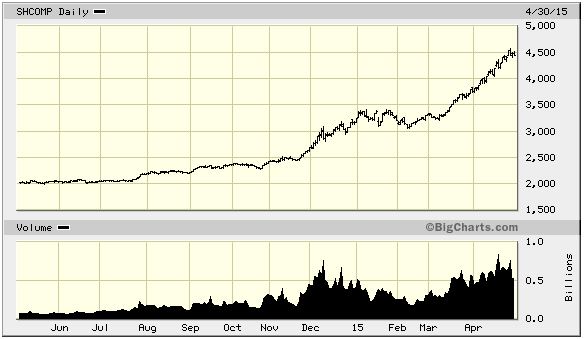
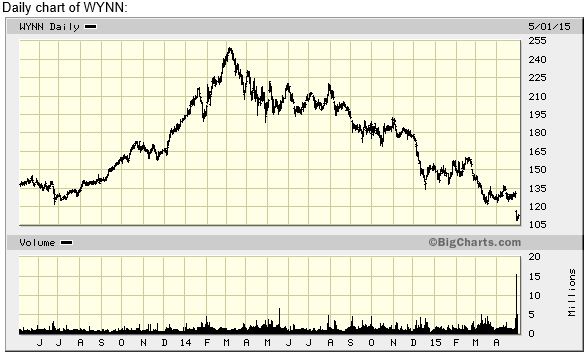
Mike’s Macro Market Musings: Bubble, Bubble, Toil and TROUBLE (2nd in a Series) Consider this the second installment of a short series of columns discussing and illustrating financial market bubbles. In the last monthly column I had mentioned the bubble brewing in the Chinese equities markets as evidenced by charts of the Shanghai Composite Index and anecdotal accounts of a full blown mania among Chinese retail “investors”. Further evidence of the Chinese stock market bubble can be witnessed in the charts of the gaming and casino stocks who derive significant portions or their revenues and earnings from their operations in Macau, a gambling haven for the Chinese public, their Las Vegas equivalent. Revenues and earnings for these companies have significantly declined in the past year or so as the Chinese public has shifted their gambling capital from Macau to their public stock exchanges, and the prices of these stocks, WYNN and LVS for example, have accordingly also significantly declined over the past year or so with losses approaching 40-50% from peak to recent troughs. I also postulated in my last column my opinion that a bursting of the Chinese equity bubble might just be the catalyst that pricks the bubbles evident in the U.S. and other Western equity markets One year daily chart of
Shanghai Composite Index:
I will let the following charts speak for themselves. They depict the classic anatomy of a financial bubble, and the prelude and aftermath of the Nasdaq Composite dot com bubble of 2000. Compare these to the above current chart of the Shanghai Composite Index.
Anatomy of a financial bubble:
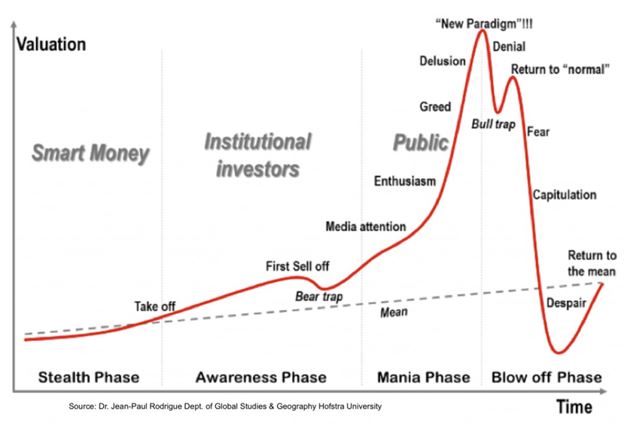
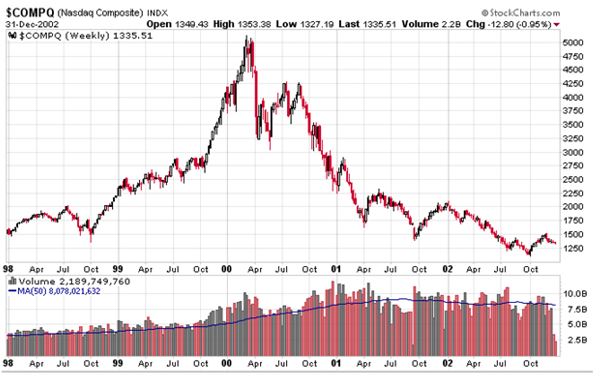
Note how the above weekly Nasdaq chart almost perfectly conforms to the above idealized graph of a typical financial bubble.
I don’t believe there can be any question that the Chinese equity markets have entered into the “greed” and/or “delusion” stages of a prototypical financial bubble, similar to the greed and delusion evidenced by the near vertical ramp in the Nasdaq in late 1999 and early 2000 shown on the above weekly chart. As of the day I am writing this (4/17/2015), news has hit the wires globally of attempts by Chinese regulators to cool things down by 1) cracking down on margin leverage offered by Chinese stock brokerage firms to the retail public and 2) making it easier to short stocks. Ironic, I think, given that many attribute the apparent Chinese market bubble to encouragement from the Chinese government. This news has created a blow off in the after-hours Chinese equity futures markets with collateral damage in the European and U.S. equity markets today, seemingly validating my theory (in the short term, at least) that a bust of the Chinese bubble might very well create similar price action in other global equity indexes. The 6-7% overnight decline in Chinese equity futures would be equivalent to a one day sell off in the Dow of well over 1000 points, or a one day sell off in the Nasdaq composite of around 300 points. Imagine the headlines in the U.S. an event of this type might create.
How might one potentially benefit from all of this? Consider short trades or put options against FXI and/or ASHR, etf’s that mirror the Chinese equity markets. In fact, ASHR is an etf that represents the Shanghai Composite Index. Or, go long on an inverse Chinese etf such as YXI or YANG (be careful with YANG, this is a 3x leveraged short etf and therefore only suitable for short term trading), both of which are currently very oversold and can be traded in a 401K or IRA account.
While physical space limits the length of this column, the next column will pick up where this one leaves off, building on the context provided within.
______________________________________________
General Market Observation: Earnings continue full bore this week. Even with the majority of the big names having already reported there should be enough this week on the earnings front to keep this week interesting! Of the Indexes the NDX is the strongest and the RUT is the weakest. All are close to support so there may be at least a relief rally for a potential downside setup anticipating further weakness going through the summer months. On the other hand with the short and shallow pullback history over the last few years this may be all we get before pushing higher. Any trades on with the Index ETFs are expected to be quick as long as current volatility remains.
SPX: Preferred ETF’s: SPY and SPXL
NDX: Preferred ETF’s: QQQ and TQQQ
RUT: Preferred ETF’s: IWM and TNA
_____________________________________________
If you have not had a chance to check out the research Mike Trager and I have done to start the EWA service you can find a short 10 minute preview at: http://youtu.be/MgC9GMAWh4w
If simplifying your life by trading along with us using the index ETF is of interest you can get the full background video at: https://activetrendtrading.com/etf-early-warning-alerts-video/
Remember if you are a premium or Early Warning Alert member you can receive Text Alerts and Trade Notifications if you send us your mobile phone number. Sent us your number with NO HYPHENS please and we’ll get you on the Text Notification List.
The How to Make Money Trading Stock Show—Free Webinar every Friday at 10 a.m. PDT. This weekly live and recorded webinar helped traders find great stocks and ETF’s to trade with excellent timing and helped them stay out of the market during times of weakness.
The “How to Make Money Trading Stocks” Show is back this Friday, May 1st
Ensure you get a seat by registering now at:
https://attendee.gotowebinar.com/register/4419440074949076993
To get notifications of the newly recorded and posted Market Stock Talk every week subscribe at the Market Tech Talk Channel: https://www.youtube.com/channel/UCLK-GdCSCGTo5IN2hvuDP0w
- The Active Trend Trader Affiliate Program is ready. For more information or to become an Affiliate please register here: https://activetrendtrading.com/affiliates-sign-up-and-login/
______________________________________________________________
ATTS Returns for 2015 through May 1, 2015
Margin Account: Invested = Less than 1%
Margin Account = +1.5% (Open and Closed Positions)
Early Warning Alerts = +2.70%
Active Trend Trading’s Yearly Objectives:
– Yearly Return of 40%
– 60% Winning Trades
For a complete view of specific trades closed visit the website at: https://activetrendtrading.com/current-positions/
Updated at the beginning of each month.
___________________________________________________________
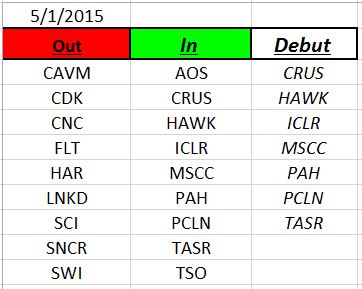
Outs & Ins: Seven stocks debuted on the IBD 50 this week. CRUS just finished a 100% run from last December so while a hot stock may need to provide a consolidation setup before jumping onboard. The others inductees are at various points in their most recent move and they include: HAWK, ICLR, MSCC, PAH, PCLN and TASR.
30% of the stocks on the IBD 50 will report this week. This may lead to another big swap out of stocks on the list this week. The stocks reporting this week include: PAYC*, LCI, MNST, ATHM, EPAM*, FLTX*, CRTO, AFSI, AKRX, MOH, WWAV, CGNX, JAZZ, HZNP and PCLN. Stocks marked with an asterisk may provide potential for a quick pre-earnings pop, but be out of them before earnings!
Comments and opinions written below this line of text may be provocative and only obliquely related to trading. Some may find these “Off the Wall” comments challenging to their outlook on life. I will not post any comments made on subject matter below this line, so if you disagree blast away.
OFF THE WALL
Off the Wall: No Off the Wall this weekend.
Share Your Success: Many of you have sent me notes regarding the success you are having with the Active Trend Trading System. Please send your stories to me at dww@activetrendtrading.com or leave a post on the website. Thanks!

