
Good Day Traders,
I will be out Monday and Tuesday on a road trip to Southern California with my wife celebrating our 42nd Anniversary. Will post in the evenings.
Thanks for all the great comments about the ATTS service and the “How to Make Money Trading Stocks” webinar that blast out every Friday at 10 a.m. Pacific. You can either join live or catch the replay on YouTube.
Here’s the link for next Friday’s Show: https://attendee.gotowebinar.com/register/7593114417647717890
The Mid-Week Market Sanity Check this Wednesday evening.
Our Topic: How to Use Weekly and Monthly Charts for Entries
General Market Observation: All three tracking Indexes sold off on Friday very nicely. The catalyst appeared to be potential Grecian default and tightening trading requirements in China. The Chinese are trying desperately to avoid a bubble on the Shanghai Composite, but that train may have already left the station. Next week Mike will be doing a special article as a continuation to his last installment from the beginning of April connecting the dots between the S&P and China. We both are seeing clues that show market top may be forming but these clues have not totally translated to market action yet!
The markets personality over the past few years has been to put in short and shallow corrections. We must remember that topping is a process and not accept an overly bearish bias even though it would be very easy to do.
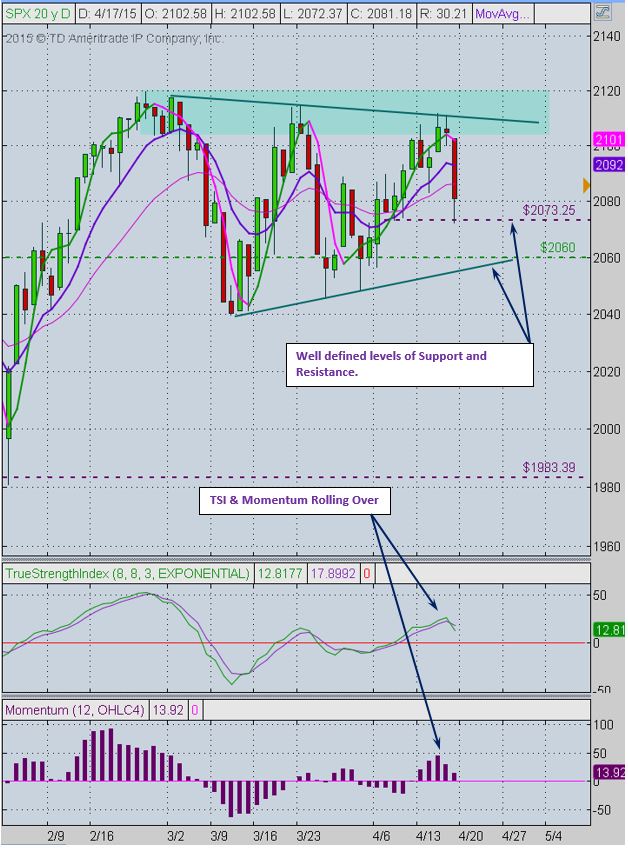
SPX: Each of the Indexes sliced through and closed below their 8 and 20 day moving averages. The S&P penetrated the 50 day intraday but closed above this important level of support! The last few brief pullbacks have demonstrated deeper moves below the 50 day moving average. If the current selloff continues then our next levels of support would start at 2073 and then notch down to 2060 and 2040. These levels would provide potential bounce entry locations for ETF or Option trades. If price moves back to the 8, 20 or 8 day Hull moving averages a potential bearish trade may set up.
Daily TSI and Momentum have rolled over so short term downside trades with proper set-ups may be in order this week.
Preferred ETF’s to trade will be SPY and/or SPXL.
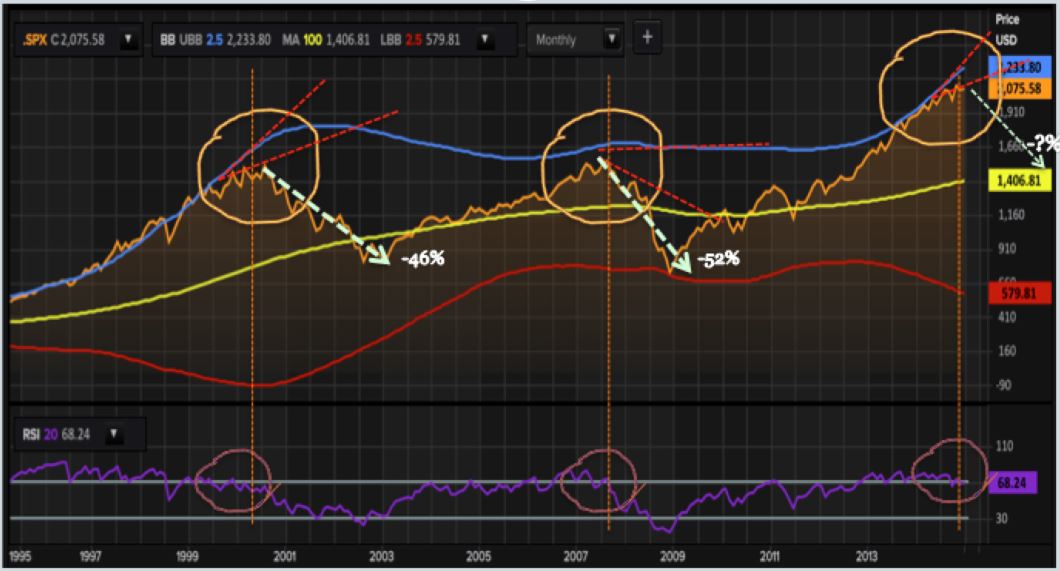
This next chart of monthly price action on the S&P highlights some of what Mike will covering in his next two articles. The current price action which is hugging a 2 deviation upper Bollinger Band sure looks like topping may be going on. We all know that history does repeat itself. The last two times over the past 20 years when the S&P reached current extremes there were corrections of -46% and -52%. A similar 50% correction from current levels of 2081 would resulted in a correction down to 1040. That would certainly reset the markets!
NDX: The NASDAQ 100 turned its daily Hull 8 day Moving Average pink this week. An interesting additional observation is that the weekly Hull turned pink last week. The last 4 out of 5 times this happen the index pulled back more significantly and actually dropped below the 100 day moving average. Twice the pullbacks dropped to or just short of the 200 day moving average. With the summer months coming on when stock prices tend to meander about without a lot of direction, could this current selloff be providing clues for more downside? If prices fail at 4285 then move down to 4090 complete a technical pattern when a price range pattern fails. A move of this magnitudes would also breach the 200 day moving average. Note a fall of this amount is just about the same range as recent weekly ranges. Hmmm!
If prices rebound next week and the velocity of the rebound weakens at the 8 or 20 day moving averages then another drop may be in the offing! The 4285 level provides strong support.
Preferred ETF’s for the NDX are either QQQ or TQQQ.
RUT: Friday’s gap down by both the Russell and NASDAQ was more pronounced than the S&P. After the last big down day on 3/25 the RUT staged a next day reversal that led to a nice upside rally on falling Momentum. Friday’s fall came to a stop around 1250 which defines a support zone that funds down to about 1240. The bottom of this support zone also coincides with an up-trending 50 day moving average. A retest up into Friday’s bearish candle would provide a bearish trade opportunity. A straight drop from Friday’s close to the 1240 area followed by a reversal candle would potentially provide a bullish entry. Like the other Indexes the daily Hull moving average has turned pink, so no bullish trades until back above the Hull and it changes to green or a bounce at strong support.
Preferred ETF’s are IWM or TNA.
When I’m trading to the Indexes to the downside it will be with the non-leveraged ETFs either shorting or put options.
______________________________________________
If you have not had a chance to check out the research Mike Trager and I have done to start the EWA service you can find a short 10 minute preview at: http://youtu.be/MgC9GMAWh4w
If simplifying your life by trading along with us using the index ETF is of interest you can get the full background video at: https://activetrendtrading.com/etf-early-warning-alerts-video/
Remember if you are a premium or Early Warning Alert member you can receive Text Alerts and Trade Notifications if you send us your mobile phone number. Sent us your number with NO HYPHENS please and we’ll get you on the Text Notification List.
The How to Make Money Trading Stock Show—Free Webinar every Friday at 10 a.m. PDT. This weekly live and recorded webinar helped traders find great stocks and ETF’s to trade with excellent timing and helped them stay out of the market during times of weakness.
The “How to Make Money Trading Stocks” Show is back this Friday, April 24th
Ensure you get a seat by registering now at:
https://attendee.gotowebinar.com/register/7593114417647717890
To get notifications of the newly recorded and posted Market Stock Talk every week subscribe at the Market Tech Talk Channel: https://www.youtube.com/channel/UCLK-GdCSCGTo5IN2hvuDP0w
- The Active Trend Trader Affiliate Program is ready. For more information or to become an Affiliate please register here: https://activetrendtrading.com/affiliates-sign-up-and-login/
______________________________________________________________
ATTS Returns for 2015 through April 17, 2015
Margin Account: Invested = In Cash
Margin Account = +0.0%
Early Warning Alerts = +2.70%
Active Trend Trading’s Yearly Objectives:
– Yearly Return of 40%
– 60% Winning Trades
For a complete view of specific trades closed visit the website at: https://activetrendtrading.com/current-positions/
Updated at the beginning of each month.
___________________________________________________________
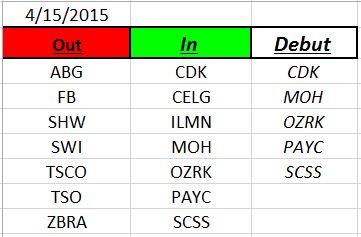
Outs & Ins: Nice shake out on the IBD 50 this weekend with 5 new stocks joining the ranks for the first time this year. CDK, MOH, OZRK, PAYC and SCSS make their debut. Each of the added stocks are trading in a horizontal consolidation pattern. PAYC made big moves at the beginning of the year. The big positive is that each of these adds are not over extended!
OZRK, MEI and GBX have already reported earnings for this quarter. This week WAL, PNK, ORLY, SCSS, MANH and UA report earnings. IBD’s Leaderboard webinar from the first quarter introduced a strategy of buying weekly options the day before earnings which kind of surprised me. Buying any option right before earnings can be either hugely rewarding or lead to a 100% loss. So if you are trying this strategy keep you position size very small!
Comments and opinions written below this line of text may be provocative and only obliquely related to trading. Some may find these “Off the Wall” comments challenging to their outlook on life. I will not post any comments made on subject matter below this line, so if you disagree blast away.
OFF THE WALL

Off the Wall: The big difference between assuming and presuming is the latter is an arrogant thinking one is right! It seems that our culture has moved into an era where we tend to jump directly over assuming and go directly to presuming. Yes the “I’m Right” and “You’re Wrong” mentality seems to be the way many want to go through life. Add on top of this the attitude of if you disagree with me then you must be racist or phobic about what I believe and thus I should be offended seems to be a way that many folks go about getting their own way. It seems that gone are the days of honest discussion and debate. Gone are the days when we had respect for a person’s right to have a different opinion!
Some in Washington D.C. are calling for elected state officials to pledge allegiance to theories and perceptions of fairness that were cooked up by intellectuals in search of a utopian existence. If the state officials don’t agree then Federal funds will be withheld from their states. This approach certainly doesn’t seem very fair but there will be state officials willing to sell their souls for a few morsels from the Federal trough.
One of the liberties we have or used to have was the right to our beliefs and respect for other folks to have their beliefs. But today there almost seems to be a viciousness that comes out for anyone who disagrees with a certain canned perception of the US or the world or any other topic. In so many ways as the search for utopia goes on we lose our individual design and vigor! Hopefully the surviving believers in freedom will be adequate to stem the current tide. Hmmmm?
Share Your Success: Many of you have sent me notes regarding the success you are having with the Active Trend Trading System. Please send your stories to me at dww@activetrendtrading.com or leave a post on the website. Thanks!