Good Day Traders,
Overview & Highlights: I’ve dropped anchor in Paragould, AR until the 27th then back on the road to Texas and point west. Tune in for training this Wednesday evening to learn about how well seasonality works in planning a trading campaign. In today’s edition, Mike Trager has hit another homerun with his macro look on what’s going on with the market. Eventually the inertia of all the items Mike highlights will slow and eventually stop the current advance. The potential downside may be cataclysmic! For now we must trade what the market gives us.
Webinars: At Active Trend Trading we offer two webinars per week to provide training plus trade and market updates. See the schedule below for the next webinars.
How to Make Money Trading Stocks on Friday, Aug 26th—Friday!
Register Here: https://attendee.gotowebinar.com/register/3109323602625198340
11:00 a.m. PDT
Next Training Webinar: Aug 24th
For Premium Members our Wednesday evening training is developing some fantastic traders!
Topic: Sector Seasonality—Does it Work?
Mike’s Macro Market Musings: Title: TTID, TINA, and RTTM
Anyone who has been reading these columns for any length of time should be aware by now that, in the very long term (meaning years, not days or weeks), I am bearish on the U.S. equity markets. John Hussman (hussmanfunds.com) makes a pretty compelling argument for his projection that 8-12 years from now the U.S. equity markets, as gauged by the popular indices we monitor, will not be at substantially different levels than they are currently, resulting in the lack of any notable nominal return over a period of many years, albeit with many ups and downs and profitable shorter term trading opportunities along the way. However, his projections are by no means guarantees and are based on historical precedents which, in the current markets, seemingly have much less influence than one might anticipate.
For now, however, the S&P 500 has broken out of a significant trading range of over a year’s duration, with a low of roughly 1800 and a high of roughly 2100 (actually, 1810 and 2130 would be more accurate numbers, but let’s do a bit of rounding to keep the following arithmetic simple). Traditional technical analysis tells us that when a well-established trading range has been broken, the extent of that range can be added to the upper bound to determine an approximate likely target price for the breakout (and vice versa for a breakout to the downside). Adding 300 S&P points to the aforementioned 2100 yields an eventual target of 2400 for SPX, somewhat equivalent to around 240 for SPY. Given that the global central banks have resorted to printing money out of thin air and using the proceeds to buy equity etf’s and individual stocks in both U.S. markets and overseas markets, there is no reason for this eventual target to not be achieved, especially in light of the policies of central bankers to create an investing environment suggesting that currently “there is no alternative” (TINA) to the equity markets for getting some kind of positive return on your investing capital.
That’s the technical analysis. What about the fundamental analysis? Despite the observation that domestic equity markets long ago stopped following any fundamental considerations, I think it is a given that eventually, at some point, fundamentals do and will matter. At least, historically, they always have, despite the current belief of many that “this time is different” (TTID). One of those fundamentals is the time tested concept that stock prices ultimately follow earnings of said stocks. That’s not to say that there can’t be temporary distortions of this concept when prices become either over or under extended from the underlying fundamental earnings – there have always been periods of distortion in both directions which are eventually reconciled by a normalization of that particular relationship, a process known as “reversion to the mean” (RTTM).
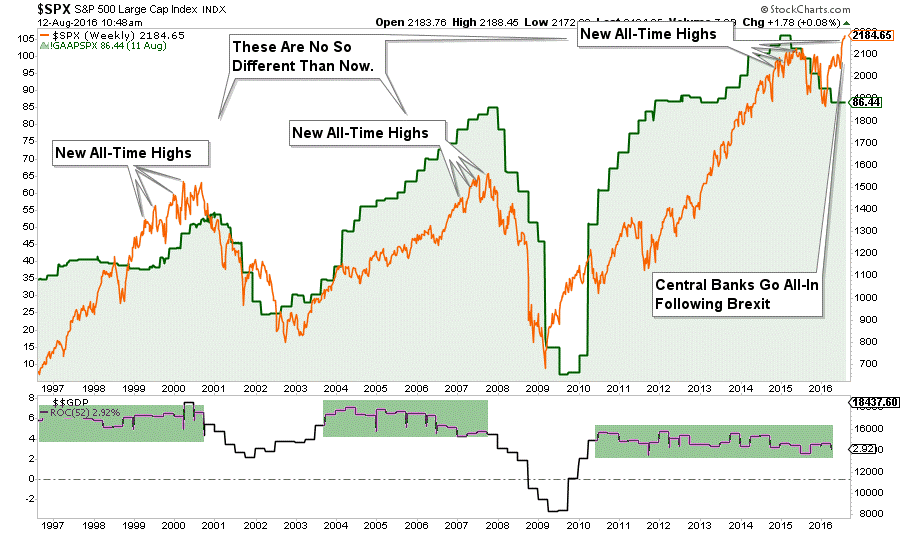
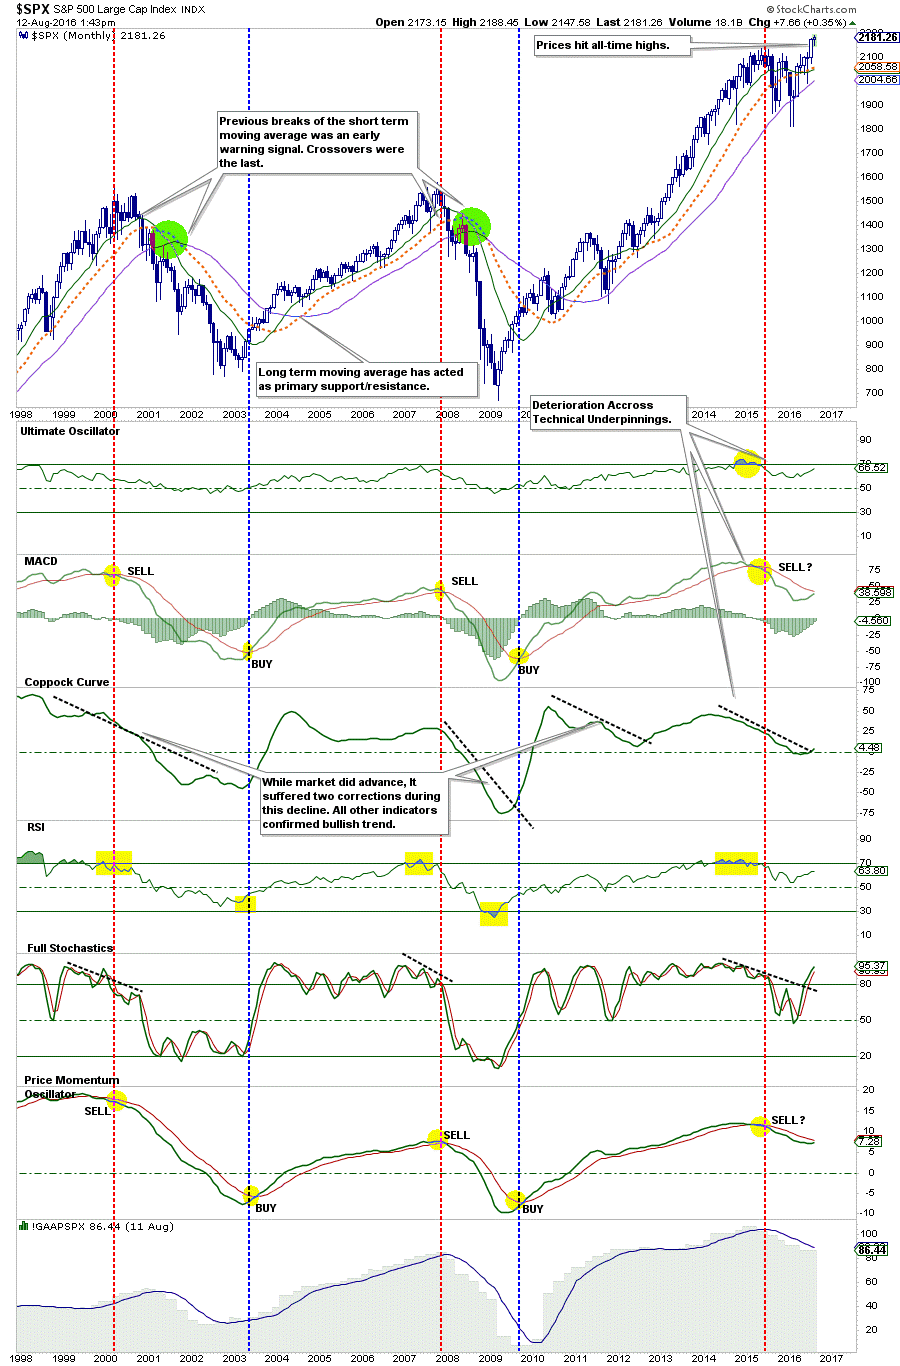
So let’s take a look at the fundamental earnings picture for the S&P and see how it relates to current price action. As always, a picture or two can save hundreds or thousands of words.
What are the above charts showing us? The first chart shows that S&P GAAP earnings have been declining over the past 15 – 18 months even while SPX price has advanced due to an increase in the P/E multiple. At roughly 2100 in early 2015 and with GAAP earnings at that time of about $106, the P/E multiple for SPX was approximately 20, historically quite high (the historical norm for the SPX P/E ratio is around 14 -15). Note that since then SPX earnings have significantly declined to a current reading of around $86 (a significant decline of nearly 20% in a relatively short period of time) while SPX price action has advanced to what is essentially now 2200, resulting in a P/E multiple of 26, nosebleed territory which has only been observed once or twice before in over 100 years of U.S. stock market history. Note: please keep in mind that I am rounding off a bit here, but not by much, to keep the math easy and to illustrate the concepts
The second chart is a monthly SPX chart going back about 18 years showing various indicators and oscillators and the associated negative divergences and historically proven sell signals.
So why, in light of the extreme overvaluations observed above and the technical breakdowns, does equity index price action continue to advance? Why are prices climbing while earnings are declining and the underlying technicals are deteriorating? Blame (or credit) the central banks, which are completely insensitive to price, valuation, and economic fundamentals, and whose buying is dictated by a wholly different agenda. If one accepts that valuations always eventually revert to their mean (RTTM), and they always have historically, it is easy to put a number to these concepts. Given the current GAAP SPX earnings of $86 and a historical norm of 14-15 times earnings for the SPX P/E, a valid argument could be made that current fair value for SPX should be around 1200 – 1300, 40 – 45% below current readings. This assumes that earnings won’t change (they will) and that the historical average P/E of 14 – 15 will ultimately be realized without overshooting to the downside (it may or may not) as valuations revert to their means (RTTM).
So, in the shorter term, the path of least resistance for SPX price action seems to be to the upside, especially given the determination of central bankers to not upset the apple cart, so to speak, prior to the November U.S. presidential election. It seems to me a given, however, that the longer this process continues, the more extreme valuations become, the more irresponsible the central bankers and their actions and policies prove themselves to be, the more painful the ultimate reversion to the mean will be. The only unknowns seem to be when it will happen, how long it will all take to play out, and what will trigger the eventual pullback to fair value.
There is no denying that, in some respects, this time is different (TTID) – never before in the history of domestic equity markets have the central banks been as interventionist and heavy handed as they now are. What is the true current fair value for SPX in an essentially zero rate interest environment? I don’t think we can know for sure since there is no precedent for the current investing environment. We’ve never been here before, so we don’t know how it all eventually plays out. Don’t forget the central bankers use of the word “experiment” when discussing their monetary policies and actions over the past several years – yes, they are “experimenting” with your savings, your pension, and your future, and the results of “experiments” are not always known in advance. However, not much imagination need be employed to foresee that maybe it all doesn’t turn out so well in the end. For now, though, party on!
General Market Observation: Earnings season is just about complete so where to from here? Each of the three Tracking Indexes showed some stalling last week, but no indication that they were ready to turn over. One of the Fed Presidents made some noise about raising rate at the next meeting and the Russell hiccupped a bit. It seems unlikely that the Fed raises rates until after the November election. While there will be some uncertainty moving towards the Fed meeting and report on September 21st, so the Indexes may just mark time awaiting the outcome of that meeting. The Fed will be holding their symposium in Jackson Hole this week and Janet speaks during market hours on Friday. Will she spook the markets? We don’t know!
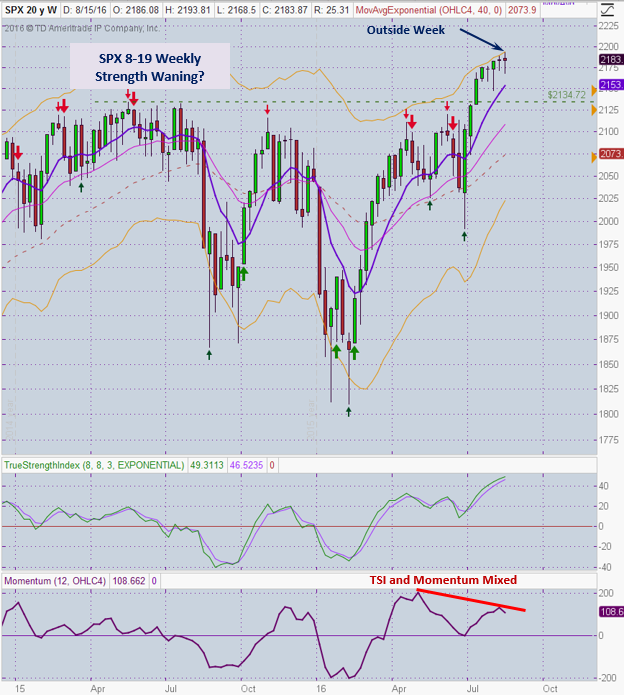
I want to highlight the weekly chart of the SPX this weekend. First last week was another small body Doji candle. Not a reversal signal but one showing that there was indecision last week. Next the TSI & Momentum indicators are showing mixed signals. The TSI is overbought but now showing it is ready to reverse. The Momentum oscillator is showing negative divergence on a weekly basis. Current prices are extended away from the moving averages so a pullback or sideways move while the moving averages catch up may be in order. Even though a new high was made last week, with negative divergence showing up we can contemplate a downside trade to either the 8 week EMA or even the breakout level of 2134. One trigger I’ll look at is a move above last week’s candle body and then a reversal back below the 2183.87 level. If you are trading the SPY see which prices would be for a downside SPY trade. I would not expect much but a move back to 8 week EMA or 2135 trading the inverse Index ETF would provide a 4% – 10% move.
The NDX and RUT made new highs in this uptrend on Monday and then flailed around the remainder of the week. Keep an eye on the inverse ETFs for both the RUT and NDX for a potential pop of between 4% – 10%. All the inverse Index ETFs are showing positive divergence which may pan out soon if price action on the Indexes weakens through the remainder of August into the historical weak month of September.
SPX: Downside Market Short the SPY, SPY Puts or SPXU.
Preferred Long ETF’s: SPY, UPRO and SPXL
NDX: Downside Market Short the QQQ, QQQ Puts or SQQQ.
Preferred Long ETF’s: QQQ and TQQQ
RUT: Downside Market Short the IWM, IWM Puts or TZA.
Preferred Long ETF’s: IWM and TNA
The How to Make Money Trading Stock Show—Free Webinar every Friday at 11:00 a.m. PDT. This weekly live and recorded webinar helped traders find great stocks and ETF’s to trade with excellent timing and helped them stay out of the market during times of weakness.
How to Make Money Trading Stocks on Friday, Aug 26th—Friday!
Register Here: https://attendee.gotowebinar.com/register/3109323602625198340
11:00 a.m. PDT
To get notifications of the newly recorded and posted How to Make Money Trading Stocks every week subscribe at the Market Tech Talk Channel: https://www.youtube.com/c/MarketTechTalk
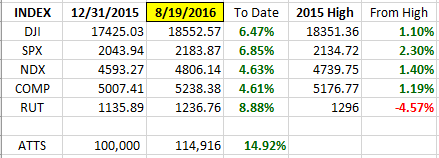
Index Returns YTD 2016
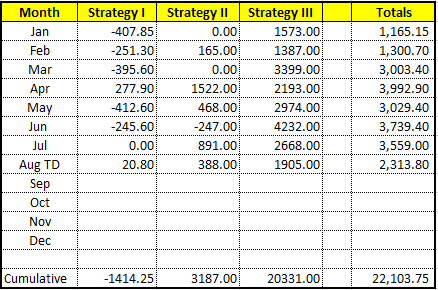
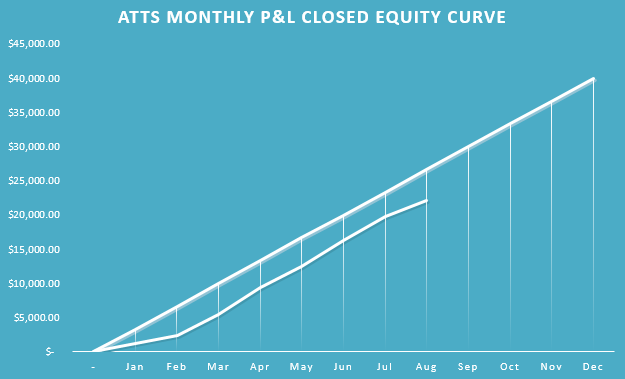
ATTS Returns for 2016 through Aug 19, 2016
Percent invested initial $100K account: Strategies I & II invested at 8.6%; Strategy III invested at 25.98%.
Current Strategy Performance YTD (Closed Trades)
Strategy I: Down -1414.25 or -2.0%
Strategy II: Up $3187.00 or +3.18%
Strategy III: Up $20331 or +74.15%
Cumulative YTD: 22.1%
Active Trend Trading’s Yearly Objectives:
– Yearly Return of 40%
– 60% Winning Trades
– Early Warning Alert Target Yearly Return = 15% or better
For a complete view of specific trades closed visit the website at: https://activetrendtrading.com/current-positions/
Updated first full week of each month. The next update August.
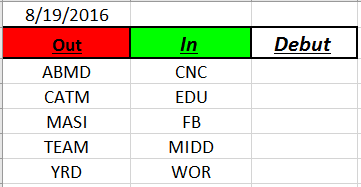
Outs & Ins: No new debuts on this weekend’s IBD 50. Stocks of interest include GRUB, COR, PLNT, BMLY, CNC, WOR & EDU. Remaining potential Pre-Earnings stocks include FIVE, AVGO and PLAY.
Share Your Success: Many of you have sent me notes regarding the success you are having with the Active Trend Trading System. Please send your stories to me at mailto:dww@activetrendtrading.com or leave a post on the website. Thanks.

