Good Day Traders,
Beat the fee increase in January 2016. Lock-in and save 40% or more as a Premium Member or Early Warning Alert Member or both. In January 2016 membership fees will increase on both Active Trend Trading and the Early Warning Alerts. You can lock-in at a reduced rate and save 40% or more off the current membership amount. This reduced monthly or yearly memberships will never go up as long as you maintain an up to date membership. This offer expires on January 1, 2016.
Lock-in your membership here: https://activetrendtrading.com/monthly-membership-intro1/
Overview & Highlights: Ok, the Fed raised rates, and no matter what we think about the action it is now a fact that will impact the market going forward—for better or worse. I want to thank Mike for another well thought out article on Mean Reversion and what this could mean when there is an over-evaluation in the market. If history provides an insight into what may be in store for we will be thankful that the Active Trend Trading System will take us out of the market ahead of the debacle.
Webinars: At Active Trend Trading we offer two webinars per week to provide training plus trade and market updates. See the schedule below for the next webinars.
How to Make Money Trading Stocks on December 26th
Register Here: https://attendee.gotowebinar.com/register/6170324386318180609
Next Training Webinar: Have a Great Christmas Week, next session Dec 29th
For Premium Members our Wednesday evening training is developing some fantastic traders!
Mid-Week Market Sanity Check Topic: Part 3: Wealth Building by Portfolio
_____________________________________________________
Managing Existing Trades: As the market continues to show weakness the Active Trend Trading Strategy 1 mechanics has kept our risk exposure low and will take us out of our current open position on any further weakness. These mechanics will put us on the proper side of any correction, protect portfolio profits and position us in cash regardless of when the rebound starts
Strategy I: Currently 1 open trades. CBM closed 12/18.
Trade 1: Entered CBM on a pullback to the 8 day EMA on 11/19. Sold ½ the position when T1 = 54.34 was triggered on 11/25. Hard Stop has been moved to breakeven or 49.40.
On 11/25 Closed 175 shares at 54.30 for a profit of $857.50
On 12/9 entered another 175 shares at 51.76
On 12/18 Closed 175 Shares at 49.40 breakeven
On 12/18 Closed 175 Shares at 49.67 stop loss loss of -$362.25
Total Profit = $495.25
Trade 2: Entered HAWK at 47.10 on 12/3 on a bounce from the 8 day EMA. T1 = 10% above entry at 51.81 and the Hard Stop is at 45.22.
Current position down: -3.4%
Strategy II: No Open Trades
Several members have asked about this strategy and a more detailed explanation is available at: https://activetrendtrading.com/wealth-and-income-strategy/ .
I posted a video about how to choose the weekly options to short for this strategy. It can be viewed at: https://activetrendtrading.com/videos/
Additionally some of these trade may be selling weekly puts on up trending stocks. If you are interested in parallel trading this strategy register at this link: http://forms.aweber.com/form/99/1278533099.htm
The Early Warning Alert Service has hit all seven major market trading points this year. See this brief update video for more details: Early Warning Alerts Update Video or at https://youtu.be/aVE9zqbG4MQ
If simplifying your life by trading along with us using the index ETF is of interest you can get the full background video at: https://activetrendtrading.com/etf-early-warning-alerts-video/
Mike’s Macro Market Musings: Topic: Mean and Inverted Reversions and Market Valuations
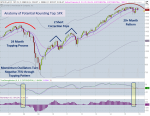
What Does It All Mean? As the old saying goes, those who don’t remember history are doomed to repeat it. Or, as applied to the financial markets, the market may not exactly repeat itself but it often rhymes with itself. These are mere colloquialisms for the concept of mean reversion – that is, when the markets move to an extreme away from some longer term average or mean or trend, history shows us that at some point the markets will invariably revert back to that mean or trend. As Yogi Berra (RIP, Yogi, you certainly deserve to) might have said, it may not happen every time, but it does happen all the time. However, in this consideration it does happen every time. Or, as Newton observed, for every action there is an equal and opposite reaction. Additionally, in the financial markets, there is a repeated historical tendency for markets to not only mean revert but to actually mean invert – that is, in the process of reverting to some sort of mean, there is a proven pattern of overshooting that longer term mean to the opposite extreme (“equal and opposite reaction”) So let’s see how this concept applies to the consideration of valuations in the U.S. equity markets. I will assume for purposes of this examination that the reader is familiar with concepts of equity valuation metrics such as price/earnings ratios (P/E) and price/sales ratios (P/S). Also, I will assume that everyone reading this can objectively and logically accept the fact that these metrics always eventually revert to their means and have an historical tendency to invert over the course of U.S. stock market history, and that the very long term average for the P/E for the Dow and S&P 500 is approximately 14 or 15 times earnings for the preceding 12 months prior to any discussion of same. As Kevin Bacon’s character in the film “A Few Good Men” stated, “These are the facts, and they cannot be disputed.” In the same film, Jack Nicholson’s character also exclaimed, “you want the truth? You can’t handle the truth!” Which I also find especially appropriate here. Please keep in mind that this column is being written on 12/13/15 and therefore cannot account for any market price action after today. So, what is the “truth” regarding current market valuations? The following chart will provide a clue:
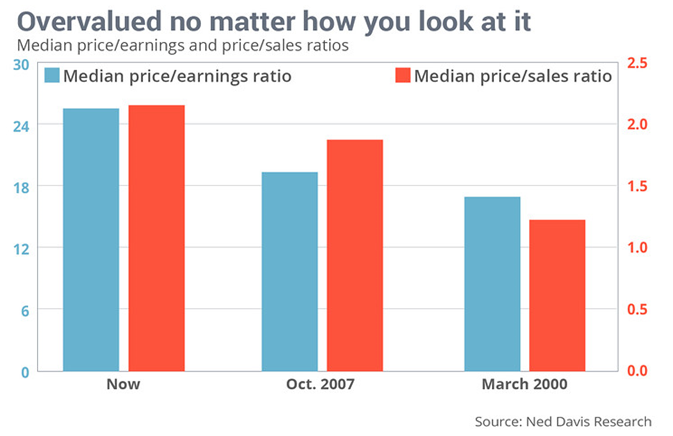 The title for the chart just about says it all. Currently, the valuation metrics for the median stock in the NYSE composite and the S&P 500 are more expensive than they were at prior market peaks in 2000 and 2007. In fact, according to Ned Davis Research, a well-known and highly respected market research organization, the price/earnings ratio currently for the median NYSE stock is the highest it’s ever been since his data series began in 1980 — except for the bear-market lows of October 2002 and March 2009, when earnings were depressed by recessions. A similar story is told by the price/sales ratio. The median S&P 500 stock currently has a ratio of 2.16, according to Davis, versus 1.9 in October 2007 and even lower in March 2000. The median stocks’ price/sales ratio has never been higher than it’s been this year. Any casual student of market history will recall what happened after those peaks were previously realized as these valuation metrics underwent their mean reversion and inversion processes. Some simple arithmetic can provide some insight into the full extent of what a mean reversion in these valuation metrics could imply. The median NYSE-listed stock has a price/earnings ratio of 25.6, when calculated based on trailing 12-month earnings. If we assume that the long term mean for this metric is 15, a 40% correction in the S&P 500 from its current level of approximately 2000 implies a downside target in the area of 1200, and this is assuming simply a mean reversion based on current trailing 12 month earnings. Historically, earnings decline during periods of recession (a recession is most assuredly in the offing with a market decline of this type), implying an even lower potential downside target. And, of course, mean inversion could indicate a pullback in the P/E ratio to below the 15 historical average; in fact, a pullback in P/E ratios to single digits has historically been a hallmark of very long term historic secular equity market lows. A lower P/E on lower earnings logically projects an even lower eventual downside target for the popular market indexes than the aforementioned 1200 area for the S&P. This type of mean inversion was not allowed by the central banks in 2009 and we can’t know right now if they will be able to stop it once again next time. Maybe, maybe not.
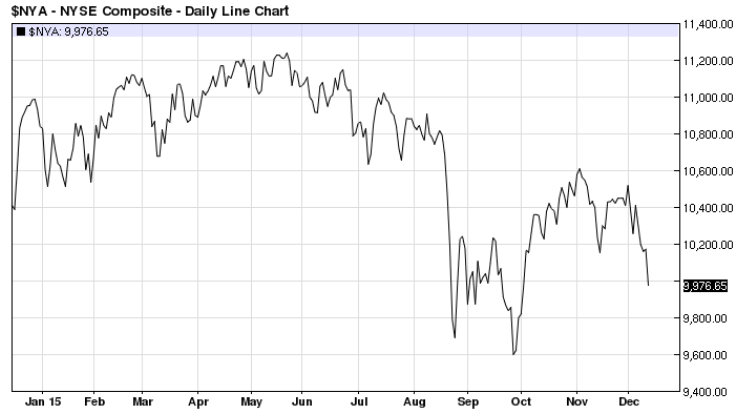
According to John Hussman, of whom I have previously spoken (or written), a 40-55% eventual drawdown in nominal equity index prices from the peaks established earlier this year would be just a normal or average event in the context of an historical perspective. And lest one be unduly dissuaded of these projections by recent price action in popular market cap weighted indexes such as the S&P 500 and Nasdaq, the following chart of the equal weighted NYSE Composite could be interpreted as indicating that this drawdown process is already in effect, as depicted by the current downtrend in this index which has been ongoing for several months now:
Does the prospect of a 50% market drawdown scare you? It shouldn’t, it should be welcomed. It will eliminate the current excesses and distortions in the equity markets and present a rare and lucrative longer term buying opportunity which won’t require precise market timing, much like 2003 and 2009. Is it inevitable? The likelihood of such an event seems logical and certainly enjoys some precedent, but it remains to be seen. It was hard to visualize at prior market peaks in 2000 and 2007 just as it is hard to visualize currently. Again, some perspective is warranted – from the perspective of a 100+ year monthly or yearly chart of the Dow, it would represent nothing more than a higher low in the overall progression of a very long term uptrend in the U.S. equity markets.
General Market Observation: Prior to the Fed Decision we said that it would take a few days for the market to digest the decision. From Thursday and Friday’s action looks like the market may have a bit of indecision over the rate hike and planned rate hikes going forward. Could it be that the market is smarter than the Fed? We all know the major reason the Fed raised rates was to save face! The main reason for a rate hike is to stymie inflation and to cool a hot economy. The inflation the government counts is not a problem and the current economy is the slowest growing in history! Hmmmm! No matter how much lipstick Janet Yellen tried to put on the pig, the FED is now out of synch with the rest of the world and out of synch with the real American economy!
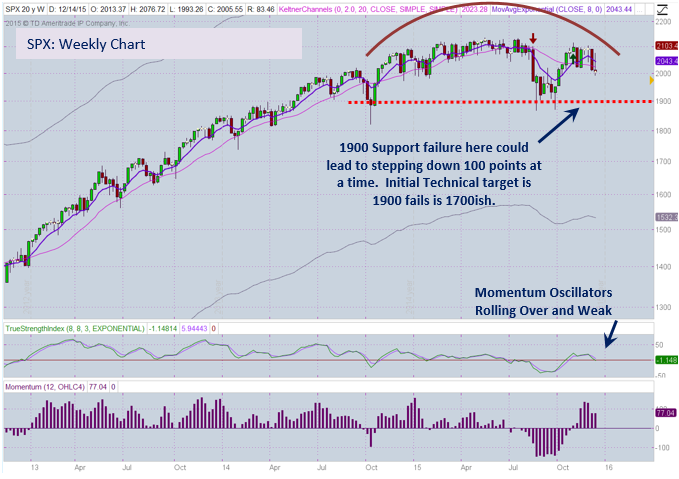
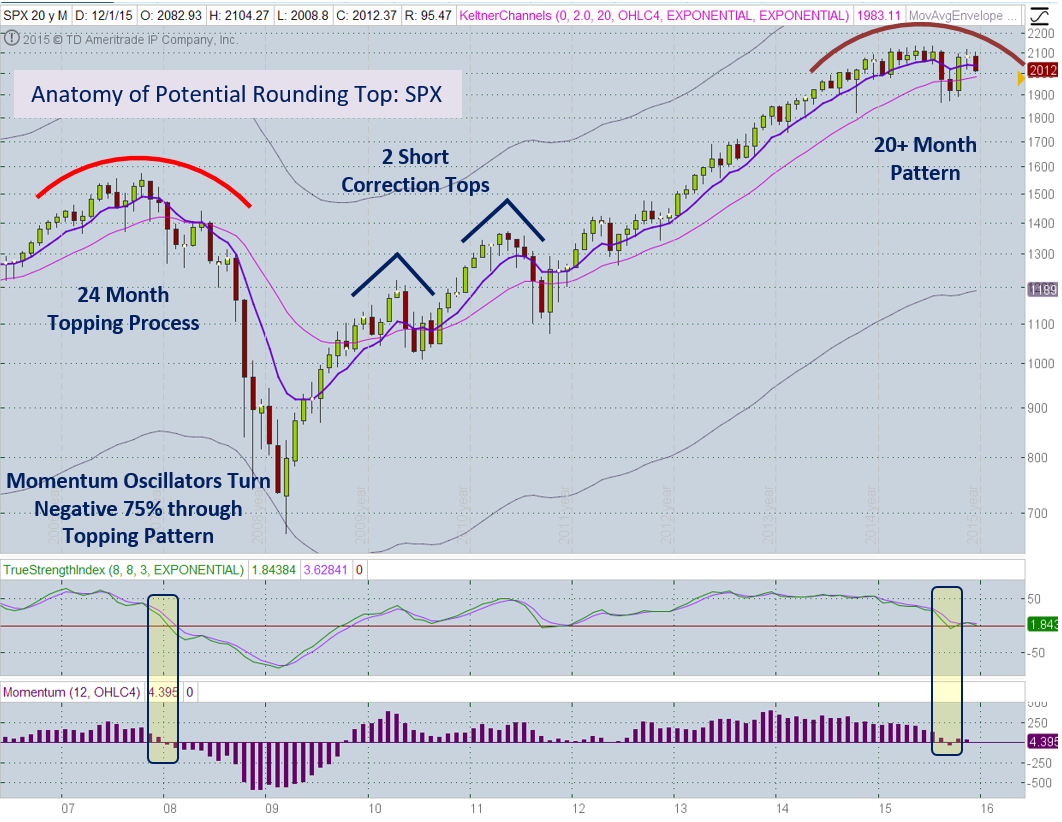
So what does this translate to for us traders as we navigate through the BS? The weekly chart below of the SPX provides a bit more of a close up of the rounding top that appears to be reaching a critical stage. Price could rattle around a bit more for several weeks and months but is there underlying strength in the companies that make up the indexes? No! Over the past 6-7 years all the corrections have been short and shallow. Will this characteristic change? At this point even though there are clues to say no, the full Monty plunge has yet to occur and may wait until 2016. Will a Santa Claus rally kick in? Perhaps but I would expect it to be muted and work within the established support at 1900 and resistance around 2100. Each of the other tracking indexes are also moving within established ranges so we watch those for clues. Trade support up and if you trade to the downside, trade resistance down.
SPX: Downside Market Short the SPY or SPY Puts. Preferred ETF’s: SPY, UPRO and SPXL
NDX: Downside Market Short the QQQ or QQQ Puts. Preferred ETF’s: QQQ and TQQQ
RUT: Downside Market Short the IWM or IWM Puts. Preferred ETF’s: IWM and TNA
The Early Warning Alert Service has hit all seven major market trading point this year. See the updated video at: https://activetrendtrading.com/early-warning-alerts-2/
If simplifying your life by trading along with us using the index ETF is of interest you can get the full background video at: https://activetrendtrading.com/etf-early-warning-alerts-video/
The How to Make Money Trading Stock Show—Free Webinar every Friday at 10 a.m. PDT. This weekly live and recorded webinar helped traders find great stocks and ETF’s to trade with excellent timing and helped them stay out of the market during times of weakness.
The “How to Make Money Trading Stocks” Show Dec 18th
Register Here: https://attendee.gotowebinar.com/register/6170324386318180609
To get notifications of the newly recorded and posted How to Make Money Trading Stocks every week subscribe at the Market Tech Talk Channel: https://www.youtube.com/channel/UCLK-GdCSCGTo5IN2hvuDP0w
The Active Trend Trader Referral Affiliate Program is ready. For more information or to become an Affiliate please register here: https://activetrendtrading.com/affiliates-sign-up-and-login/
Index Returns YTD 2015
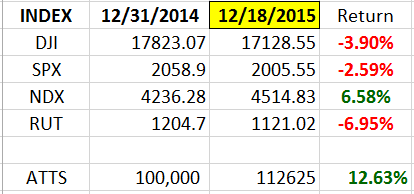
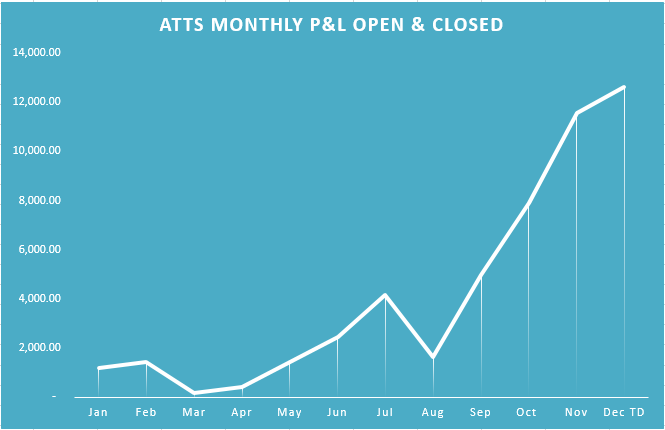
ATTS Returns for 2015 through Dec 18, 2015
18% Invested
Margin Account = +12.6% (Includes profit in open positions). See chart below for monthly tracking.
Early Warning Alerts = 10.8% Partial Positions; 19.4% Full Positions
Active Trend Trading’s Yearly Objectives:
- Yearly Return of 40%
- 60% Winning Trades
- Early Warning Alert Target Yearly Return = 15% or better
For a complete view of specific trades closed visit the website at: https://activetrendtrading.com/current-positions/
Updated first full week of each month.
___________________________________________________________
For our all Active Trend Trading Members here’s how we utilize our trading capital
Trading Capital Setup and Position Sizing: Every year we start the year off trading a $100K margin account split up into the three strategies used with the Active Trend Trading System.
- Each trader must define their own trading capital in order to properly size trade positions to meet their own risk tolerance level!
- Strategy I: Capital Growth—70% of capital which equates to $140K at full margin. This strategy trades IBD Quality Growth Stocks and Index ETFs. Growth Target 40% per year.
- Strategy II: Short Term Income or Cash Flow—10% of capital or $10K. This strategy focuses on trading options on stocks and ETF’s identified in Strategy I. The $10K will be divided into $2K units per trade.
- Strategy III: Combination of Growth and Income—20% of capital or $20K. This strategy will use LEAPS options as a foundation to sell weekly option positions with the intent of covering cost of long LEAPS plus growth and income.
- The $70K Strategy I portion of the trade account is split between up to 4 stocks and potentially a leveraged Index ETF. Actual number of shares will vary of course depending on price of the entity traded and amount of margin available. We have found that limiting open positions to only 5 entities greatly reduces the trade management time requirements for members.
- Naked Puts or short term options strategies will be used occasionally for Income Generating Positions
- None of the trade setups are recommendations to trade only notification of planned trades from set ups using the Active Trend Trading System. Each trader is responsible for establishing their own appropriate risk level if they decide to parallel trade.
- The Active Trend Trading System objective is to provide a clear and simple system designed for members who work full time.
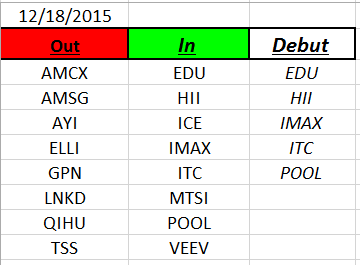
Outs & Ins: EDU, HII, IMAX, ITC and POOL make their debut on this week’s elite IBD 50 list. A total 215 stocks have made an appearance on the IBD 50 thus far in 2015. One clue to look for if the market is going in the tank is the quality of stocks on the IBD 50. When the market gets weak or has been in a prolonged Bull Market lower quality stocks come onto this computer generated list. This is a clue to the market’s weakness. EDU, IMAX (also on Leaderboard) and ITC look like the strongest players added to this week’s list.
Current only 11 of the 50 stocks on the list are above their 8 day EMA and only 24 are above their 8 week EMA. Sorting off either the weekly or daily 8 period EMA allows us to hone in on the strongest of the stocks on the list. If the market strengthens stocks that have held above these moving averages may provide the first upside movers. Remember 65-76% of stocks will follow the Indexes.
Share Your Success: Many of you have sent me notes regarding the success you are having with the Active Trend Trading System. Please send your stories to me at dww@activetrendtrading.com or leave a post on the website. Thanks.