Good Day Traders,
Very good week and very good month this June! I want to thank all the member’s who’ve emailed and called with suggestions on how we can continue to improve Active Trend Trading! Plus thanks for those who have been sharing your success following the system!
If you are a new subscriber to Active Trend Trading, watch for an invitation to the Mid-Week Review Webinar for paid subscribers it will come out Sunday, June 29th.
If there is ever a question about a potential set-up email me at dww@activetrendtrading.com or call me at 808-366-0397 and get clarification!
Remember every Friday at 1:30 p.m. PDT, the Active Trend Traders co-host the free “Market Stock Talk” Webinar. I want to invite you to attend register here:
https://attendee.gotowebinar.com/register/7447066281624517634
General Market Observation: The Market continues in a Confirmed Uptrend as we approach the end of June. The S&P is up to 3 distribution days followed by the Nasdaq with 2 D days. For the week the Nasdaq was the strongest of the three Indexes we track, moving into price territory not seen since fourteen years ago in 2000! The Russell showed resiliency after selling off on Tuesday and rebounding on Wednesday and Friday. For the week the S&P traded within a defined price range appearing to be digesting gains. Overall the Indexes were mixed for the week with the S&P being down 1.9 points for the week. Both the Nasdaq and Russell were up slightly. The Russell did its yearly rebalancing of holdings AMC on Friday, if you follow individual stocks in this Index check for an update this weekend or Monday.
Going into next week the charts and candlestick pattern on the daily charts basically show us that the uptrend continues and we are now less extended than we were last week. How long can the uptrend continue? Nobody knows and even though a more prominent pull back might seem to be an appropriate action, the trajectory continues up. Arguing with the current trajectory can be hazardous to one’s trading account so enjoy the ride, and we’ll be looking for clues of weakness.
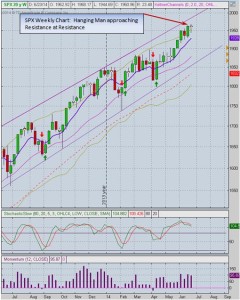
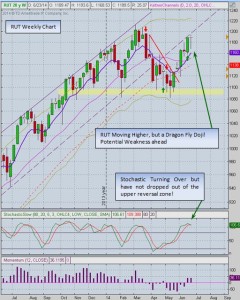
The weekly charts on the SPX & Russell show Dragon Fly Doji candlestick patterns or Hanging Men patterns. These are considered bearish reversal signals and should be taken as a clue to be cautious in opening any new position, especially if the entry is based on a Breakout. Many of the recent breakouts on the elite list have been sluggish with little momentum.
Summary of Closed Trades: For the month of June we have closed 9 trades. 8 trades have been profitable and 1 trade lost 1.43%. The 8 profitable trades were a combination of both Income Generating Trades and Capital Growth Trades. Working with a margin account of $100K in trading capital the following actual profits have been achieved through the end of the 4th week in June.
Profit/Loss from June Trades Closed as of June 27th
Income Generating Trades Closed = + $ 5,029.50
Capital Growth Trades Closed = + $ 1,869.00
Total Profit/Loss Month to Date = + $ 6,898.50
For a complete view of specific trades closed visit the website at: https://activetrendtrading.com/current-positions/
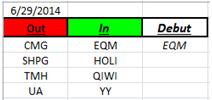
Outs & Ins: EQM makes its debut on the IBD 50 list this weekend and guess what? It’s extended but pulling back to the 8 day EMA. This stock has run over 60% from the first of the year. The stock only trades an average of 422K shares per day so will not make the cut for addition to my Private Watch List.
However there is plenty of other stocks setting up with defined Buy Points and some of them include, EPAM, UBNT, JAZZ, FFIV, GILD, & YY. We entered a position in YY earlier this week based on price action triggering a proper entry Action Point for ATTS. QIWI was added back to the IBD 50 this weekend even though it just triggered the 8% Sell Rule. The thumbnail charts with the identified buy point provided in the Monday and Wednesday editions of IBD are excellent places for busy traders who trade breakouts to find opportunities.
Off the Chart Special: The Off the Chart section normally appears in our Trader’s Report edition of the Art & Science of Active Trend Trading. I wanted to share this special Off the Chart with all members to provide some food for thought about alternative entries in comparison with breakout entries. Plus it show why I tend to be more interested in what falls off the IBD 50 over what debuts on the list each week.
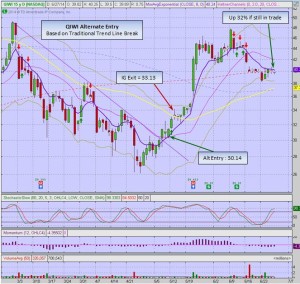
The stock in focus is QIWI which was the number one stock on the IBD 50 at the beginning of 2014. It fell off the list when prices started falling soon after the first of the year. We know that QIWI had a buy point trigger from a C&H pattern of 46.47 which filled on 6/9/14, but the breakout failed and the 8% stop provided the safety net exit from this position.
Let say the person trading this breakout executed the following trade:
Bought 200 shares of QIWI at 46.47
Sold 200 shares of QIWI based on the 8% rule at 42.75
For a loss per share of $3.72 per share or a total loss of -$744 on 200 shares
To be clear this was a successful trade ensuring a proper breakout entry and a proper capital protection stop loss. But what if a trader used an alternative entry approach what would those results have been?
QIWI acted a lot like DDD did last year. DDD started the year on the List, fell in price and fell off the list then bottomed and provided an excellent opportunity for the observant to take part in a 100%+ gain by the end of 2013! In the case of QIWI, if one was simply diligent in checking chart at least weekly and following traditional technical analysis tools they could have gotten in QIWI early, taken some profits and might still be in a part of the position enjoying the capital growth.
The alternative entry trade would have triggered an entry Action Point on either May 7, 8 or 9th. Partial profits could have been taken at the first significance resistance zone at the 50 day SMA on one-half of the holding and the other half would still be open waiting for a proper Action Point to add more shares.
What would this trade have looked like:
Bought 200 shares of QIWI at 25¢ above the 8 day EMA at 30.14
Sold 100 shares of QIWI at the 50 day SMA on 5/13 at 33.13 up 9.9% from entry
Gain per share of 2.99 or a profit of $299 on the Income Generation portion of the trade
On the remaining 100 share: Purchased at 30.14, and currently valued at 39.89 showing a 32% profit.
Of course those trading with ATTS would have already closed the second half of the position using the 8 day EMA Rule at 43.02. This would have resulted in a return of 43% on the second half of the position over a 40 day period.
I know some will say this is just cherry picking one stock where an alternative entry worked. Do alternative entries work every time? No they do not, but do Breakout entries work every time? What I’ve found over years of observation and research is that alternative entries work with about the same success percentage as breakout entries. This is about 60-70% of the time. Learning how to trade alternative entries is a great tool to add to any trader’s tool kit. They do provide profitable opportunities while waiting for the breakout that may or may not ever happen.
Comments and opinions written below this line of text may be provocative and only obliquely related to trading. Some may find these “Off the Wall” comments challenging to their outlook on life. I will not post any comments made on subject matter below this line, so if you disagree blast away.
OFF THE WALL 
Off the Wall: Never mistake simple for unsophisticated! This is really a profound statement considering that most of us take a lot of pride in our sophistication! Let’s admit the fact that living and working in the Silicon Valley fosters a sense of being pretty sophisticated in how we see ourselves! I won’t say that people who reside in these valleys think that they are better than those from other parts of the country, but—maybe they seeing themselves as just a bit more advanced and progressive would be a better way of labeling the smug spirit that tends to linger over this locale. So when I mention that simple can be very sophisticated, they kind of blink their eyes because this concept just doesn’t compute with their self view.
I think we engineers may be the worst for coming up with elaborate plans to make very simple and successful things supposedly better by adding levels of complication. I know we are trained and educated to make things better, but this constant tinkering can in fact make some things worse and unusable except by our fellow engineers. I wish I had a commission free trade for every new trader with an engineering background said they were working on process that would totally automate their trading. I could trade for a couple of year’s commission free.
Please understand, I’m not saying that refinement of trading systems is wrong, but what I’m saying is that if a person is wired to be sophisticated in thought, they may refuse to take the time to master the simple! By not mastering the simple, I believe they set themselves up to fail. After failure they often set off on the journey many of us have taken in search of the Holy Grail of trading or the Holy Grail of making the black box of automated trading. It’s like being stuck in a giant “Do” Loop. Let’s see how many remember that term!
At the end of my own search I penned the following motto that is now the guidance for what I do in trading—Clarify, Simplify & Multiply. Has it worked? Yup!
Share Your Success: Many of you have sent me notes regarding the success you are having with the Active Trend Trading System. Please send your stories to me at dww@activetrendtrading.com or leave a post on the website. Thanks!


