Good Day Traders,
Overview & Highlights: This week’s edition has a fantastic article by Mike Trager. Mike is a student of market history and some of what he reveals this week will give one a new perspective on what’s going on in the markets!
Looking forward to a huge month in April for all three Strategies. Wealth Building and Cash Flow Strategy III has been clicking all year so far. Portfolio building in Strategy I has been our laggard. I had a great discussion with a trader who concentrates on portfolio building this weekend. He said he has been totally in cash for the whole year and reiterated it is not a time for portfolio building, yet!
Webinars: At Active Trend Trading we offer two webinars per week to provide training plus trade and market updates. See the schedule below for the next webinars.
How to Make Money Trading Stocks on Friday, April 8th
Register Here: https://attendee.gotowebinar.com/register/2523589566158199555
Next Training Webinar: April 6
For Premium Members our Wednesday evening training is developing some fantastic traders!
Mid-Week Market Sanity Check Topic: Simple Option Trades
Mike’s Macro Market Musings:
Topic: The 80% Solution for Bunny Markets; Mind the GAAP
Before we get into the “meat” of the following text, let’s set a couple of definitions first. For purposes of this discussion, a “bunny market” (it is Easter season after all) is defined as an equity market that hops around relentlessly like a bunny but really doesn’t go anywhere, an apt description of U.S. equity markets over the past couple of years. And “GAAP” is the acronym for “generally accepted accounting principles”, a standard brought to bear on reported accounting and financial reports that quite often is not adhered to.
So what is the 80% solution to which the title of this article refers? First the chart, then the answer:
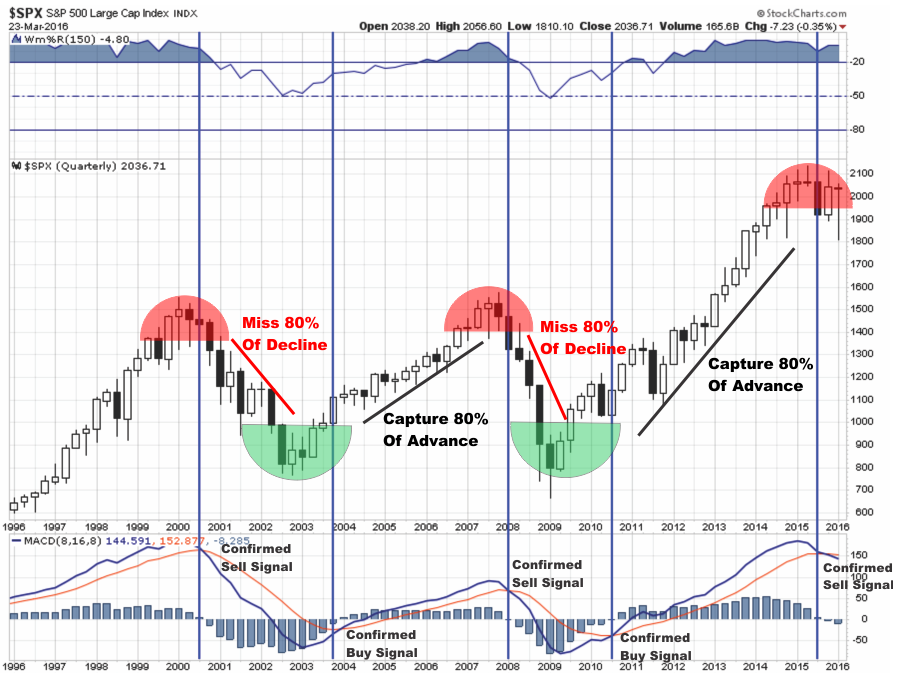
This is a quarterly chart for the S&P 500 going back 20 years to 1996. Each candlestick represents a quarter’s, or 3 months, worth of price action, 4 candlesticks per calendar year. The MACD oscillator (which is often considered a trend following indicator) at the bottom is set at 8,16,8, normally a rather quick setting for this indicator prone to false whipsaw signals, but it is smoothed on this chart by the slow movement of the quarterly data. Note that during the past 20 years this indicator has generated five actionable signals when there is either an upside or downside crossover. 4 of these 5 signals have accurately predicted longer term macro moves in the S&P. The fifth signal, generated at the close of the third quarter of 2015, is currently too recent for us to know whether it will ultimately prove to be as prescient as the previous four signals. Also, note that current and recent pricing of the S&P 500 is at the same level it was in the third and fourth quarters of 2014, signifying that the overall market has essentially gone nowhere for the past year and a half or so despite having “hopped” around a good bit. Nonetheless, bunny markets do present multiple opportunities to buy corrections and sell rallies for good shorter term profits.
Accepted trading wisdom from those with decades of experience in the markets considers it to be a fool’s errand to try to capture precise market tops and bottoms. The goal is to capture the “meat” of the move between inflection points, entering and exiting markets once a trend reversal is noted and established. True trend following methodologies almost guarantee that tops and bottoms will be missed but if one can consistently capture anywhere from 1/2 to 3/4 of the ensuing move once the trend reversal is apparent, healthy and rewarding profits are just about unavoidable. And this has been the modus operandi of just about every successful investor with whom we are familiar, including Mr. Buffett. The author of the article from which the above chart is copied is trying to show that the MACD crossover signals on the above chart can capture up to 80% of the longer term macro moves to the upside in the S&P 500 while avoiding (or possibly shorting) up to 80% of the inevitable downside, a prescription for long term investing success. Currently this indicator is on a sell signal which has not been changed by the strong bounce in the markets during the first quarter of 2016, said bounce generating the current hanging man quarterly candlestick usually considered to have bearish implications. As a sidenote, the past few quarterly candlesticks (hanging men, shooting star, doji) have overall bearish connotations – for comparison, note the two consecutive quarterly hanging man candlesticks preceding the 2000-2001 dot.com crash.
It is also accepted market wisdom from the buy and hold crowd that missing out on the best days in the market is detrimental to longer term investing success. The following graph begs to differ:
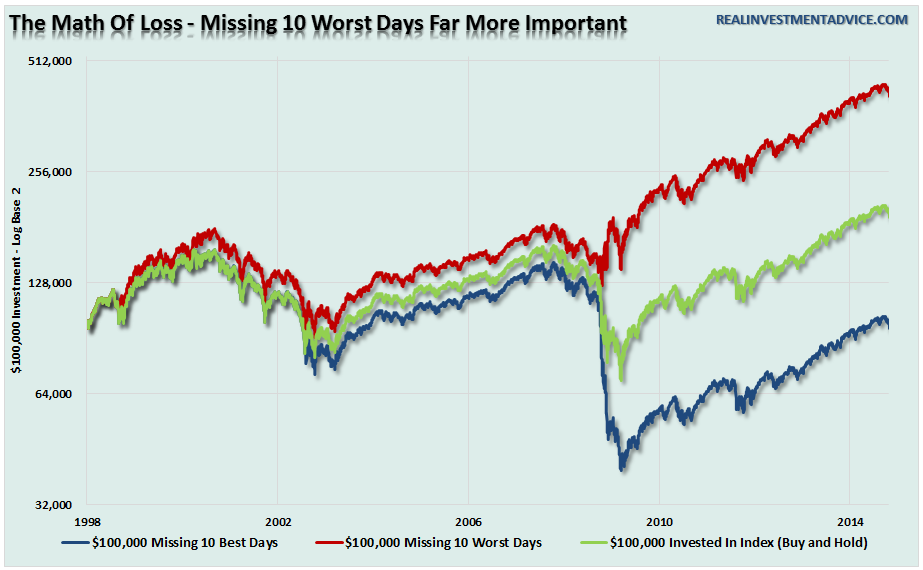
I think this speaks for itself. Seems like it is far more important to avoid the 10 worst days than it is to enjoy the 10 best days. That is, at least since 1998. Further, the majority of the “Best-10” and “Worst-10” days are contained primarily within those 80% spans.
MIND THE GAAP: I love the phrase “mind the gap”, the quaint manner in which the English warn of the small space between the platform and the train when stepping onto and off the trains in the underground metro system and the more conventional above ground trains. I have spoken and written before of the games that many corporations play with their quarterly and annual earnings reports and the “gap” between reality and many of these reports. There is also often a pretty good sized gap between reported pro forma earnings, which ignore some of the more rigorous accounting standards imposed by generally accepted accounting principles (GAAP), and more honest earnings numbers that do adhere to GAAP standards. Or, the GAAP gap, as one might refer to it. A recent article in the Wall Street Journal addresses the GAAP gap and its potential implications in the following graphic:
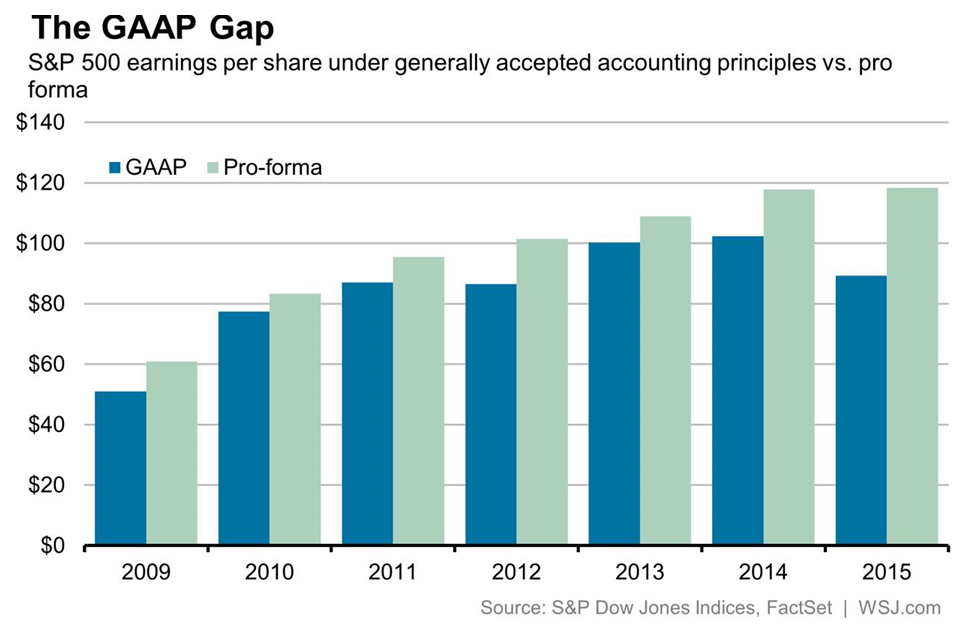
Now that the final results for the calendar year 2015 are known, overall S&P 500 earnings under GAAP came to $787 billion last year, S&P Dow Jones Indices estimates. That is $256 billion less than the pro forma estimate of $1.04 trillion, or a ratio of GAAP earnings to pro forma earnings of approximately .75. This figure of .75 is the current GAAP gap. Outside of 2008, the only other times the GAAP gap was as wide as last year was in 2001 and 2002. That was back when companies wrote off billions of dollars’ worth of dot-com bubble-era investments. We should all know by now what happened in the equity markets in 2001-2002 and 2008-2009 when the GAAP gap was as wide or perhaps a bit wider that it is currently. When combined with the aforementioned long term sell signal on the quarterly S&P chart, I don’t see how anyone can claim to be surprised by any potential follow through to the downside the markets may experience going forward. Anyone expecting significant upside advances in the markets from current levels given the current technical and fundamental backdrop should perhaps reconsider.
But maybe this time really is different. The manipulation of and intervention in global markets by global central banks truly is historically unprecedented and could very well override all other influences and considerations and invalidate all historical comparisons.
However, that’s a topic for a different conversation or column. Hope everyone had a great Easter holiday! Enjoy the bunny markets!
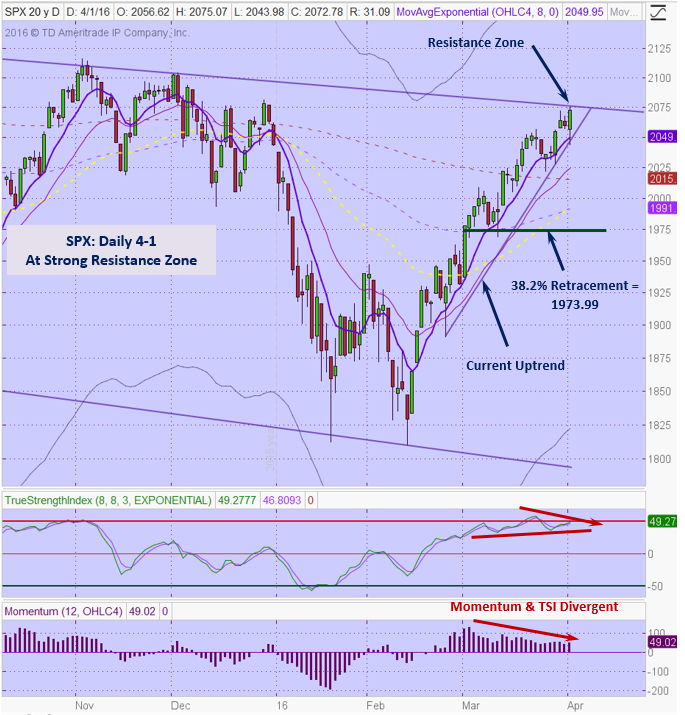
General Market Observation: Friday was a pretty amazing day in the markets. If the action would have been at the end of downtrend it would have been a strong bullish reversal. Technical indicators and price action were saying it was time for a healthy pullback to a buying action point and we actually got one in the first 5 minutes of the cash session. Then it was off to the races for the rest of the day. As I said mid-week the market’s action does not have to make sense or be rational, it can defy what we think it should do and be irrational beyond our imagination. But coming into next week on the SPX price action has reached a critical junction. Right at resistance from a long term downtrend resistance line that forms the top of a downtrend channel.
Will this week bring strength or weakness? From a technical perspective this is a perfect level to pullback from. But as we’ve seen during the uptrend that started on 2/11 the pullbacks have been very short and shallow. Negative divergence on the momentum indicators support this ideal but price action is still pushing higher. If the downtrend resistance line is breached to the upside this could lead to further upside movement to last year’s highs. A complete stall out at the current level could lead to an orderly and healthy pullback. A healthy pullback would bring price down to the 38.2% retracement highlighted on the chart below. At this point other than being at resistance and negative divergences being present, price action is not complimenting a downward move. Remember “Price is King”. The SPX has been the strongest of the three Tracking Indexes so their analysis is a bit different than the S&P.
Both the NDX and RUT are lagging the S&P. Price action is making progress towards the downtrend resistance lines present on the charts of both Indexes. Like the S&P neither of these Indexes are providing a strong bearish candlestick.
For each of the Indexes the 8 day EMA continues to provide support so be on guard for pullbacks to this level to plan long trades until this characteristic no longer works. Simply set an alert on each Index that will trigger when prices either at or slightly above the 8 day EMA. Then be ready with a trade order at that level. We have to have an uptrend bias until the price action tells us it times to change our mind.
SPX: Downside Market Short the SPY, SPY Puts or SPXU.
Preferred Long ETF’s: SPY, UPRO and SPXL
NDX: Downside Market Short the QQQ, QQQ Puts or SQQQ.
Preferred Long ETF’s: QQQ and TQQQ
RUT: Downside Market Short the IWM, IWM Puts or TZA.
Preferred Long ETF’s: IWM and TNA
The How to Make Money Trading Stock Show—Free Webinar every Friday at 10 a.m. PDT. This weekly live and recorded webinar helped traders find great stocks and ETF’s to trade with excellent timing and helped them stay out of the market during times of weakness.
How to Make Money Trading Stocks on Friday, April 8th
Register Here: https://attendee.gotowebinar.com/register/2523589566158199555
To get notifications of the newly recorded and posted How to Make Money Trading Stocks every week subscribe at the Market Tech Talk Channel: https://www.youtube.com/channel/UCLK-GdCSCGTo5IN2hvuDP0w
– The Active Trend Trader Referral Affiliate Program is ready. For more information or to become an Affiliate please register here: https://activetrendtrading.com/affiliates-sign-up-and-login/
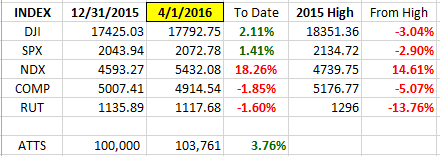
Index Returns YTD 2016
I’ve added a column to the Index YTD performance chart. The column on the far right shows the depth of the current correction with respect to the highs of the top from 2015. Note both DJI & SPX are now in positive territory for 2016.
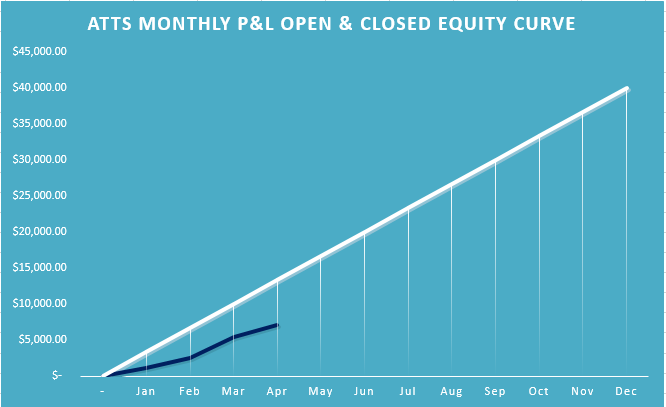
ATTS Returns for 2016 through April 1, 2016
Percent invested $100K account: Strategies I & II invested at 0%; Strategy III invested at 20%.
Current Strategy Performance YTD (Closed Trades)
Strategy I: Down -1054.75 or -1.05%
Strategy II: 14.55%
Strategy III: Up $6626 or +33.1%
Cumulative YTD: 7.02%
Active Trend Trading’s Yearly Objectives:
– Yearly Return of 40%
– 60% Winning Trades
– Early Warning Alert Target Yearly Return = 15% or better
For a complete view of specific trades closed visit the website at: https://activetrendtrading.com/current-positions/
Updated first full week of each month.
For our all Active Trend Trading Members here’s how we utilize our trading capital
Trading Capital Setup and Position Sizing: Every year we start the year off trading a $100K margin account split up into the three strategies used with the Active Trend Trading System.
– Each trader must define their own trading capital in order to properly size trade positions to meet their own risk tolerance level!
– Strategy I: Capital Growth—70% of capital which equates to $140K at full margin. This strategy trades IBD Quality Growth Stocks and Index ETFs. Growth Target 40% per year.
– Strategy II: Short Term Income or Cash Flow—10% of capital or $10K. This strategy focuses on trading options on stocks and ETF’s identified in Strategy I. The $10K will be divided into $2K units per trade.
– Strategy III: Combination of Growth and Income—20% of capital or $20K. This strategy will use LEAPS options as a foundation to sell weekly option positions with the intent of covering cost of long LEAPS plus growth and income.
– The $70K Strategy I portion of the trade account is split between up to 4 stocks and potentially a leveraged Index ETF. Actual number of shares will vary of course depending on price of the entity traded and amount of margin available. We have found that limiting open positions to only 5 entities greatly reduces the trade management time requirements for members.
– Naked Puts or short term options strategies will be used occasionally for Income Generating Positions
– None of the trade setups are recommendations to trade only notification of planned trades from set ups using the Active Trend Trading System. Each trader is responsible for establishing their own appropriate risk level if they decide to parallel trade.
– The Active Trend Trading System objective is to provide a clear and simple system designed for members who work full time.
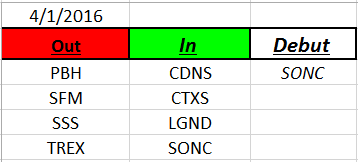
Outs & Ins: SONC is back on the IBD 50 making it’s 2016 debut. With earnings basically behind us I’m going to take another tack with the IBD 50 update weekly. I’ll list the stocks that are near IBD Buy Points (BP). This does not mean I’m recommending these stocks just highlighting that they are near IBD BPs. The following stocks are either at a BP or within the 5% window of the BP. They include: USCR, AHS, OLED, STOR, THOR, HW, VNTV, AYI, VRSK, STZ, RGR, CTRX and LGIH (Early Entry BP). The precise BP is in this Monday’s edition of IBD.
Share Your Success: Many of you have sent me notes regarding the success you are having with the Active Trend Trading System. Please send your stories to me at dww@activetrendtrading.com or leave a post on the website. Thanks.

