Good Day Traders,
I’m very excited about a new feature that is coming to Active Trend Trading with a portion starting in this week’s edition of the Trader’s Report. My longtime friend and research colleague Mike Trager will add some fabulous color to Trader’s Report in a new monthly section called: “Mike’s Monthly Market Musings”!
Mike’s monthly section will provide insight into what’s happening in the market from a macro view which will reveal clues about what to expect longer term in the market. This section will provide a valuable analysis for longer term traders. Researching past market characteristics is one of Mike’s strengths and his musing should added fullness to the Art & Science of Active Trend Trading.
Please let us know what you think about this new section that will appear at the beginning of each month.
Additionally, Mike has completed his back testing on the leverage ETF triggers that he trades each year, and for those who are really busy and a timing system that only trigger between 3-5 times a year this new service may be for you. Stay tune for additional information soon.
BTW, that’s me on the left and Mike on the right in the photo after we met in Carmel this past week.
Don’t miss the “The How to Make Money Trading Stocks—Market Stock Talk Show” every Friday at 10 a.m. PDT! If you want to jump to the head of the line register early at this link:
https://attendee.gotowebinar.com/register/3683134517354415873
To get notifications of the newly recorded and posted Market Stock Talk every week subscribe at the Market Tech Talk Channel: https://www.youtube.com/channel/UCLK-GdCSCGTo5IN2hvuDP0w
Additionally, please give David & me some “Thumbs Up” Likes and leave comments on the Market Tech Talk YouTube Channel we would really appreciate the gesture. If you share the site it would be even better! Thanks ahead of time.
Mike’s Monthly Market Musings: As October draws to a close, let’s take a look at some of the weekly and monthly index charts to see where the markets are at overall and where they’ve been, along with some other macro metrics that can provide a bigger picture and longer term perspective. I will keep my comments regarding central bank intervention in, and manipulation of, the markets to a minimum. Suffice it to say that I know I am not alone in my belief and concern that this will all end badly at some point. That is, unless it truly is different this time and the global central banks have finally discovered how to arrest the long term market and economic cycles. Price action in global markets is currently being driven by central bank actions and bears no apparent relationship to underlying valuation or economic fundamentals. However, as always, price action rules and reflects the reaction and opinions of all those in the markets to events in the world around us. For those of you who are relatively new to trading and investing and have been following the markets for just the past year or two, be aware that your introduction to the markets has occurred in the midst of a grand experiment with influences on the price action of the markets that are without historical precedent. In that regard, this time truly is different – there is no historical basis for reference or comparison.
The Nasdaq and Russell 2000 indexes recently underwent a greater than 10% pull back from their recent highs, meeting the technical definition of a “correction”, while SPX and the Dow Industrials fell just slightly less than 10%. Historically, a 10% correction occurs on average about once every 12 to 18 months. The recent correction in the Russell and Nasdaq is the first to occur in 3 years, since the correction in the summer of 2011 after the U.S. Federal Reserve Bank ended their QE2 program. SPX and the Dow remain technically “uncorrected” for slightly more than 3 years at this point in time. Apparently, all of the concerns and reasons given by the mainstream media as causes for the correction have been resolved in the past 2 – 2 1/2 weeks as the price advance has completely recovered those losses
SPX, Dow, and Nasdaq weekly chart – a very bullish follow through the past 2 weeks confirming the weekly hammer candlestick at the 50 week simple moving average. A potential double top in SPX and Nasdaq could be setting up but requires confirmation; for the Dow this presents as a potential triple top. Note that the momentum oscillators we follow, the slow stochastics and the true strength index (TSI), are pointing up but are at lower readings than they were when index prices were at their previous recent highs, a potential bearish divergence which requires price action confirmation to become actionable. Note also the usually bearish “megaphone” or broadening top formation apparent in the weekly charts of the Dow and Nasdaq, also apparent in the monthly Dow charts. The Russell 2000 (RUT) weekly chart is very characteristic of a down trending entity, exhibiting lower lows and, so far, lower highs. RUT is going to have to break or close above 1184, the most recent lower high, to establish a higher high on the weekly charts and potentially negate the downtrend.
The monthly index charts are exhibiting significant hanging man type candlesticks at or near prior highs, often a bearish signal but one which requires price confirmation. The price on all the indexes remains above the 8 month EMA which is a bullish sign for now. SPX has not closed below the 8 month EMA for well over 2 years now, an extremely rare circumstance although not unprecedented
Other considerations:
Seasonality – we are now entering the time of year when the markets can historically be counted on to rally. Historical market gains have mostly accumulated during the November – April time frame
Presidential cycle – 2014 has been the second year of the presidential cycle, historically a difficult year for the markets on average, and this year has followed that script so far. 2013 was the first year of the cycle and is also a historically difficult year, on average, for the markets. That particular script was certainly not followed in 2013, as we now know. 2015 will be the third year of the presidential cycle, historically a quite favorable year for the markets, and also the fifth year of the decennial cycle, almost invariably the most favorable year of the ten years in the decennial cycle. It remains to be seen, though, how much of the future performance of the markets has already been pulled forward into the recent time frame. Some market pundits believe this will be a significant headwind going forward.
Market cap/GDP ratio – aka Warren Buffett’s favorite market valuation metric: Currently at approximately 127%, this is considered significantly overvalued. This is the highest reading in over 40 years with the exception of the period around the market peak in 2000 prior to the dot com collapse of 2000-2002. Higher even than in 2007 prior to the bear market of 2007-2009, and significantly higher than before the market crash of 1987. According to some calculations, the expected overall market return over the next 8 years from this level of valuation is 0.9%, including the current dividend of approximately 2% for the Dow and SPX, indicating a projection of negative nominal index returns over the coming years. In an interview earlier this year, Warren Buffett indicated he becomes wary of stock valuations when this metric exceeds 100%. We passed 100% quite a while ago.
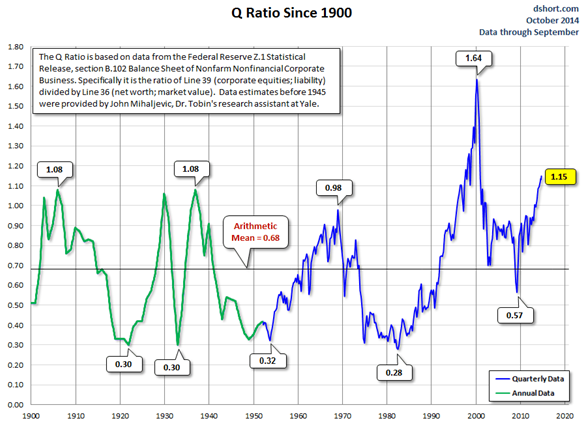
Q ratio – another valuation metric which can only be ascertained from quarterly Federal Reserve data. Not effective for short term timing, but more useful as an indicator for longer term time horizons and overall expectations of future market returns. Currently at 1.15, this valuation metric is also higher than it has ever been in over 100 years of market history with the exception of the market peaks in 1999-2000 prior to the dot com bust. Higher even than before the market crashes of 1929, 1987, and 2008, among others.
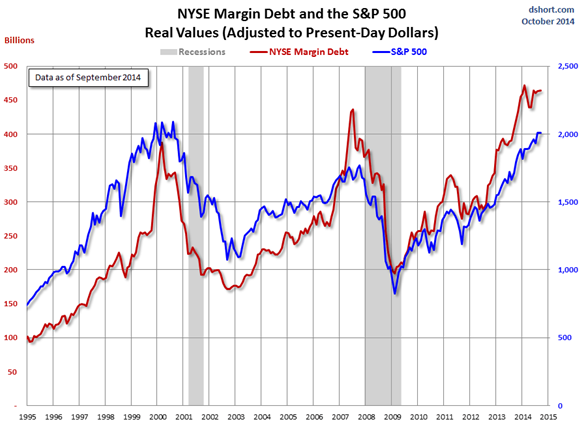
NYSE margin debt and investor credit – closely correlated to market index price levels and to each other. At extremes, as is the current status, this information can be an indication of sentiment extremes among market participants, which is currently at extremes of bullishness. Margin debt reached a peak earlier this year, higher than it has ever been in recorded market history even when adjusted for inflation, even higher than at prior historical market peaks. The current reading is less than 2% below that peak. Could the slight decline in margin debt as SPX has reached higher highs be a predictive divergence of note? Perhaps. Of particular interest is the chart below illustrating NYSE investor credit balances relative to SPX. The most recent S&P 500 correction greater than 10% was the 19.39% selloff in 2011 from April 29th to October 3rd. Investor credit balances hit a negative extreme in March 2011 prior to that sell off. It is far more negative now and, in fact, the most negative it has ever been over the past 30+ years.
Final Thoughts: By almost any objective measure of historically predictive value, the markets are currently overbought, overvalued, and over-bullish. Several indicators and metrics are at or above levels that have historically preceded significant declines. They have been there for some time now and may remain there for some time to come. Global central bank intervention in the markets remains a wild card precluding the ability of anyone to provide any kind of common sense near term forecast of market performance.
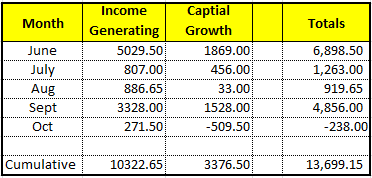
Summary of Monthly Closed Trades as of the Oct 31st since June 1, 2014:
October was a challenging trading month for both the indexes and individual stocks. There was a lot of whipsaw action with big ups and downs on a daily basis. We did not chase run away socks and ETF’s in either direction. We had to close the TSLA covered call for a loss which took our October cumulative into a small loss for the month.
Total Booked Profits since June 1 when the timing service began: $13.6K
Margin Account Up 26.2% YTD
IRA Account Up 48.9% YTD
For a complete view of specific trades closed visit the website at: https://activetrendtrading.com/current-positions/ Updated at the beginning of each month.
Share Your Success: Many of you have sent me notes regarding the success you are having with the Active Trend Trading System. Please send your stories to me at dww@activetrendtrading.com or leave a post on the website. Thanks!


