Good Day Traders,
Overview & Highlights: Opened a position in SQQQ from the leveraged ETFs on the Strategy I watch list. As we have been watching the new stable of leveraged ETFs both inverse and non-inverse, it is apparent that there will be times when our buy points will come close recent lows. This week’s Mid-Week Training will show the mechanics of what needs to be in place on the chart before jumping in on one of these trades. This training will be applicable to stocks also.
Upcoming Webinars: At Active Trend Trading we offer two webinars per week to provide training plus trade and market updates. See the schedule below for the next webinars.
The How to Make Money Trading Stock Show—Free Webinar every Friday at 11:00 a.m. PDT. This weekly live and recorded webinar helped traders find great stocks and ETF’s to trade with excellent timing and helped them stay out of the market during times of weakness.
How to Make Money Trading Stocks on Friday, Dec 2nd
Register now for the next live webinar at the link below:
Register Here: https://attendee.gotowebinar.com/register/3206516034657561603
Time 11:00 a.m. PDT
Next Training Webinar: Nov 30th
For Premium Members, our Wednesday evening training is developing some fantastic traders!
Topic: Don’t Buy the Bottom–Unless
Managing Current Trades: Positions open for 2 strategies.
Strategy I Portfolio Building: 1 Position Open
On 11-28: Bought 330 shares of SQQQ at 13.19
SL = 4%
T1 = 5%-10%
T2 = 15%-20%
Strategy II Basic Options: No Open Positions
For members wanting to better understand this Strategy there is a very good training video at: https://activetrendtrading.com/basic-option-strategy/
Closed the first TSLA LEAPS Strategy III Strangle which was opened on 9/28/15 for a 100% profit on 9/2/16.
Strategy III Wealth & Income: One Open Position
Strategy III Weekly Results Week ending 11/25:
SPY: Loss of $525.00
TSLA: Loss of $485.00
NUGT: Loss of $60.00
Trade 1: Foundation Position is 4 contracts of SPY Jan17 205C and 4 contracts of SPY Jan17 200P Current Trade—Currently Up 31.59%; Premium Collected since opening trade on 1/4/16 = $7,872
Waiting for weekly Trigger on SPY
(With the current return on the SPY position up at 31.59% it will soon be time to decide if it is time to roll to a 2018. The current long positions will expire in January. Low volatility for most of this year has limited the upside on this trade. I will institute a 3-week time stop on this trade. If during that time the residual value of the long options and the collected weekly premium reaches a return of 40%-50% I will close the position. If this is not achieved in 3 weeks I will close the position and roll to 2018. Close NLT Dec 9.)
Trade 2: (Long TSLA Jan17 250C & Long Jan17 220—Closed on 9/2 for 100% gain since 9/29) + New Positions Jan17 210C and 220P: Current Position Total Invested $14,900. Currently Up 84.4%: Premium Collected since opening trade on 9/28/15 = $15,688.50 + New Positions at $6,169.50 = Total Collected $21,858
Sold 1 2Dec 197.5C at 3.20; potential profit $320
Trade 3: Long NUGT Jan18 18.4C + NUGT Jan18 18.4P opened 9/. 4 contracts each side of the straddle for total investment of $6,720. The required weekly premium to collect each week to achieve a 100% return by Jan 2018 is $191.43 per week.
Waiting for weekly Trigger on NUGT
Tip for Experienced Option Traders: Occasionally after a weekly trade goes against me but the trend appears to be changing I will add one naked contract over and above my foundation position and close this out after it gains at least half of the premium I’ve collected. Doing naked options is not for everyone and I keep my risk small by only doing one contract above my covered limit. In other words, if I can sell 4 contract covered by my long leaps I’ll sell one additional. This helps hedge the losses a bit but it this tactic is not without risk and must maintain a tighter stop than I would normally use with the regular position.
Note: We do our best to get both text alerts and email alerts out in a timely manner, occasionally there will be trades that are missed because of delay in the Text or Email alert applications. Additionally, please double check with your broker to assure they allow spread trades like we do with Strategy III. Some do and some don’t.
Additionally, it is crucial when selling premium against the Long LEAPS position that the premium collected cover the weekly cost of holding the LEAPS plus an additional amount to over this amount as a gain. This is one of the reason I sell premium of weekly options that are close to be “At The Money”. I base my selling on the expected move during the next week. If one is not bringing enough weekly premium this trade will not work out as well and may wind up being a losing trade.
Several members have asked about this strategy and a more detailed explanation is available at: https://activetrendtrading.com/wealth-and-income-strategy/
I posted a video about how to choose the weekly options to short for this strategy. It can be viewed at: https://activetrendtrading.com/videos/
Additionally, some of these trades may be selling weekly puts on up trending stocks. If you are interested in parallel trading this strategy register at this link: http://forms.aweber.com/form/99/1278533099.htm
Early Warning Alerts for Leveraged Index ETFs: Last Trigger: 10/3. Waiting new signal or secondary trigger.
EWA Account Return to date: 10.0%
The Early Warning Alert Service alerted on all 5 market lows in 2016. A new video detailing EWA for 2016 will be out within the next 2 weeks, along with highlights on entry refinements that will provide improved entries even in environment like 2016. In 2016 the entry triggers were challenging because of the number of straight off the bottom moves. Mike and I have analyzed this and have tested adjustments in place going forward.
If simplifying your life by trading along with us using the index ETF is of interest, you can get the full background video at: https://activetrendtrading.com/etf-early-warning-alerts-video/
Potential Set Ups for this week: The Tracking Index put in what may be a swing high and thus resistance. With the weakness in the NDX today a ¼ position was opened prior to the close in SQQQ. I will look to add to this position if a pullback is substantial. NUGT is attempting to consolidate between 7.50 and 10. If gold does a seasonal run into the end of the year or at the beginning of 2017 we will be ready. If oil continues to strengthen the UCO may provide an opportunity shortly. Both ETFs are currently basing in a trading range that is over 20%.
Trades for Week of 11/28: Long SQQQ
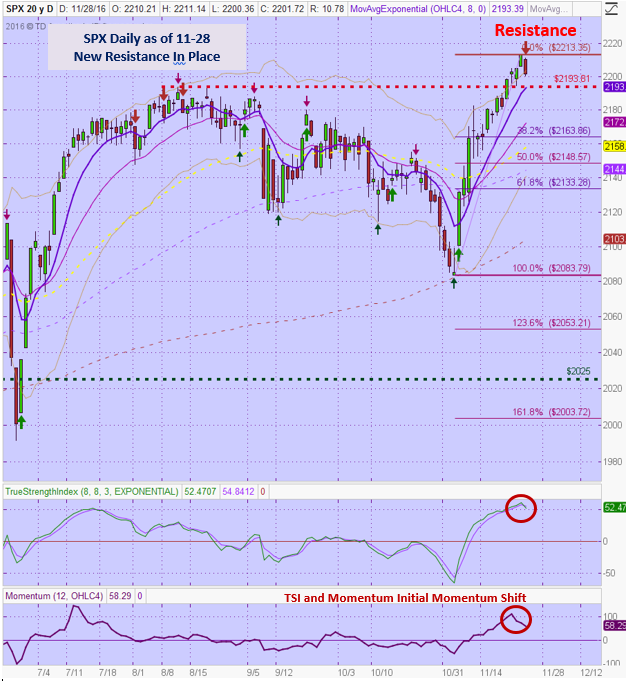
General Market Observation: We highlighted over the past week that straight up off the bottom rallies cannot go on forever. It appears that the Trump Rally may be running out of rocket fuel. From the swing low prior to the rally the RUT jumped over 16% and the SPX was up over 6%. Until today. Each of the three Tracking Indexes moved away from Friday’s highs with the NDX and SPX gapping down. The RUT showed a strong Bearish Engulfing pattern. All three Indexes were extended away from their 8/20/50 day moving averages so profit taking and a rest was in order.
While this rally has gone against many of the analyst opinions, it has been stellar. But now what? As we shared previously, internally nothing has really changed in the indexes since the election. The S&P is still overvalued and the high probability of an interest rate hike looms on December 14th. The weakest Index at this point is the NDX even though it’s cousin the Nasdaq Composite is performing much like the SPX. I will keep an eye on both and keep in mind that the QQQ emulates the NDX and not the COMP. Both the SPX and RUT have hit new highs and are in a resumed uptrend. While the NDX provides the weakest chart, the RUT may have the furthest to fall if there is a pullback to at least to the 8 or 20 day EMAs.
Other news or noise that could potentially result in a negative influence on the Indexes would be the continued push to delegitimize the election. Thus far, the Indexes have taken the unrest in stride, but this could change quickly if anything substantial happens to throw the final election result to the legislative or judicial branch for a final verdict. Right now it is just noise.
Breakout support on both the RUT and SPX will determine the depth of a pullback on those Indexes. The 50 day EMA on the NDX will provide similar information. The chart of the SPX provides breakout support at the 2193.81 level. If price break support look to lower levels support at 2180 or the 38.2% Fib retracement at 2163. I will also be looking for potential levels of support at the 20 day and 50 day EMAs. Note that the both the momentum oscillators have rolled over. Daily Momentum turned down last Wednesday and did not pick up with Friday’s high. This can be an early sign of potential internal weakness that could lead to a deeper pullback. Based on the new trend trading pullbacks is the entry of choice until that idea is voided by price action.
SPX: Downside Market Short the SPY, SPY Puts or SPXU.
Preferred Long ETF’s: SPY, UPRO and SPXL
NDX: Downside Market Short the QQQ, QQQ Puts or SQQQ.
Preferred Long ETF’s: QQQ and TQQQ
RUT: Downside Market Short the IWM, IWM Puts or TZA.
Preferred Long ETF’s: IWM and TNA
The How to Make Money Trading Stock Show—Free Webinar every Friday at 11:00 a.m. PDT. This weekly live and recorded webinar helped traders find great stocks and ETF’s to trade with excellent timing and helped them stay out of the market during times of weakness.
How to Make Money Trading Stocks on Friday, Dec 2nd
Register now for the next live webinar at the link below:
Register Here: https://attendee.gotowebinar.com/register/3206516034657561603
Time 11:00 a.m. PDT
To get notifications of the newly recorded and posted How to Make Money Trading Stocks every week subscribe at the Market Tech Talk Channel: https://www.youtube.com/c/MarketTechTalk
– The Active Trend Trader Referral Affiliate Program is ready. For more information or to become an Affiliate please register here: https://activetrendtrading.com/affiliates-sign-up-and-login/
Index Returns YTD 2016
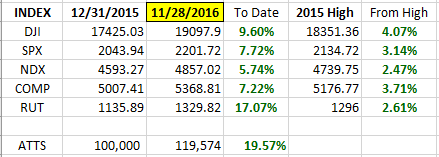
ATTS Returns for 2016 through Nov 28, 2016
Percent invested initial $100K account: Strategies I & II invested at 0.00%; Strategy III invested at 20%.
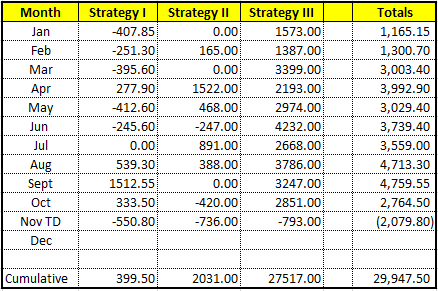
Current Strategy Performance YTD (Closed Trades)
Strategy I: Up $399.50 or +0.57%
Strategy II: Up $2,031.00 or +20.3%
Strategy III: Up $27,517.00
Cumulative YTD: 29.95%
Active Trend Trading’s Yearly Objectives:
– Yearly Return of 40%
– 60% Winning Trades
– Early Warning Alert Target Yearly Return = 15% or better
For a complete view of specific trades closed visit the website at: https://activetrendtrading.com/current-positions/
Updated first full week of each month. The next update after first week in December.
Outs & Ins: With the shortened trade day on Friday there was no new adds to the IBD 50 this weekend. Most of the IBD 50 stocks are over extended like the indexes.
Of this weekend’s list the strongest stocks fundamentally were: AEIS, AMAT, CPE, NVDA, WOR, UBNT, GIMO, THO & FOXF. Each need to wait for the moving averages to catchup with price or pullback to support for a proper entry. We will see if the indexes help with this through the remainder of the week.
Share Your Success: Many of you have sent me notes regarding the success you are having with the Active Trend Trading System. Please send your stories to me at dww@activetrendtrading.com or leave a post on the website. Thanks.